 Special Offer: Get a 'Standalone' WeeklyTrader Membership for much less than the cost of the entire Elite Membership!
CLICK HERE TO LEARN MORE
Special Offer: Get a 'Standalone' WeeklyTrader Membership for much less than the cost of the entire Elite Membership!
CLICK HERE TO LEARN MORE
Indexes spent last week grinding back toward all-time highs with the VIX anchored near 15—an outwardly calm setup that still carries embedded risk. The tone was shaped by policy more than anything else. Across the September 17–18 FOMC, the Federal Reserve delivered a 25 bp cut and framed it as risk management rather than a dash back to zero. Chair Powell emphasized data dependence with inflation still hovering just above target, which shifted the market’s debate from whether the Fed will cut to how quickly it will proceed into 2026. Equities liked the message. Rates, by contrast, stayed jumpy: the 10-year continued to oscillate inside a broad 3.6%–4.8% corridor and ended the week a touch higher as traders faded the notion of rapid, front-loaded easing.
Click Here to Subscribe to Our YouTube Channel So You Don’t Miss Out!
Macro data mostly cooperated with that narrative. Headline inflation ran firm on the month but remained broadly in line on a year-over-year basis; core cooled at the margin; producer prices eased. That combination tamped down rekindled inflation fears. The counterweight was labor. Softer recent prints, coupled with sizable downward revisions to the prior year’s job gains, reinforced the idea of a cooling employment backdrop. For equities, that cocktail was “good enough” on the day, but it also explains the Fed’s caution: an upside surprise in prices or a sharper leg down in jobs would quickly reprice the curve—and risk assets with it.
Leadership remained concentrated. Tech and AI continued to carry the tape, with Nvidia serving as the market’s barometer into its next update. The calendar around FedEx and Lennar mattered for a different reason: those reports offer a clear read on goods demand, pricing power, housing resilience, and margins—precisely the ingredients needed to broaden participation beyond mega-cap tech. Energy lagged even with only modest moves in crude, while communication services and technology did the heavy lifting. Breadth told the truth: indexes hovering near records even as many constituents chopped sideways is the classic signature of a late-stage advance dominated by a handful of leaders. With volatility suppressed and credit spreads steady, markets are effectively priced for an orderly deceleration in growth and inflation, even as the Treasury curve remains hypersensitive to every macro headline.
That was the setup as of Friday. Today, Monday, September 22, the market added a new layer. Equities rebounded after last week’s slide tied to Israel’s strikes against Iran, with traders looking through geopolitical risk as headlines pointed to de-escalation efforts and renewed diplomatic channels. The three major indexes opened higher and built on gains through the session, with growth and AI leadership reasserting themselves as nerves settled. Attention quickly pivoted back to policy. After last week’s cut, Powell’s upcoming Wednesday press conference is the week’s focal point, and markets will parse his language for clues about the pace and conditionality of additional easing. Rates reflected lingering inflation vigilance as Treasury prices slipped and yields rose. The dollar, which had caught a flight-to-safety bid late last week, eased modestly, while oil faded toward levels seen before the flare-up—both consistent with a market that is discounting immediate escalation.
Bring those threads together and the message is consistent: policy is still doing the heavy lifting; AI remains the center of market gravity; and breadth is the tell. If FedEx and Lennar can confirm resilient demand and disciplined margins, leadership has a chance to broaden; if not, the market will continue to lean on the same select winners, leaving indexes vulnerable to factor reversals when rates lurch. Our short-term stance remains market-neutral with participation: stay engaged, but let position sizing and exit discipline carry the risk management load. Within that framework, we continue to respect your Friday levels—upside potential for SPY toward 670–680 if AI momentum persists and data stay “good enough,” with support in the 600–620 zone—and we continue to treat the 10-year’s 3.6%–4.8% range as the market’s weather vane.
Bottom line: the bull case—measured Fed easing, cooling inflation at the margin, and durable AI demand—survived a geopolitical wobble and reasserted itself today. The bear case—narrow breadth, softening labor, and a rate complex that can move swiftly on any price surprise—hasn’t gone away. Trade the tape you have, not the one you want, and let the calendar do some work this week.
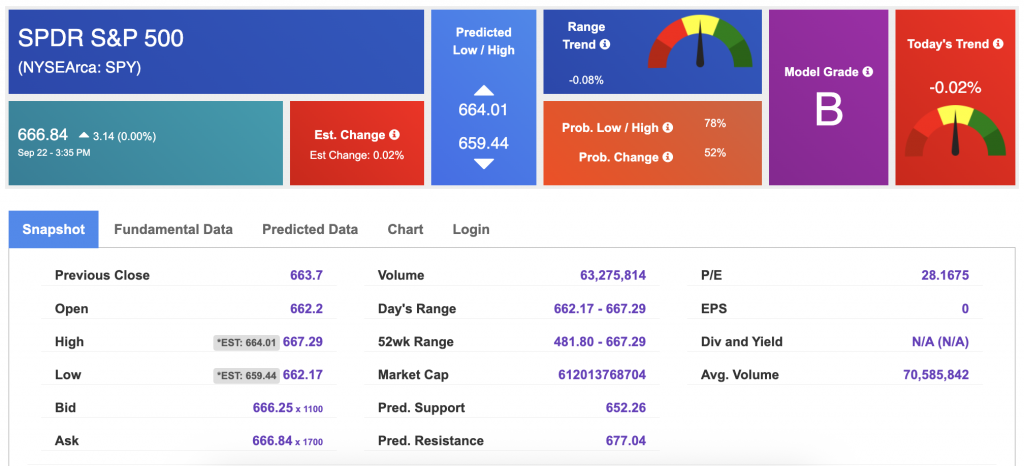
Using the “SPY” symbol to analyze the S&P 500, our 10-day prediction window shows a near-term positive outlook. Prediction data is uploaded after the market closes at 6 p.m. CST. Today’s data is based on market signals from the previous trading session.
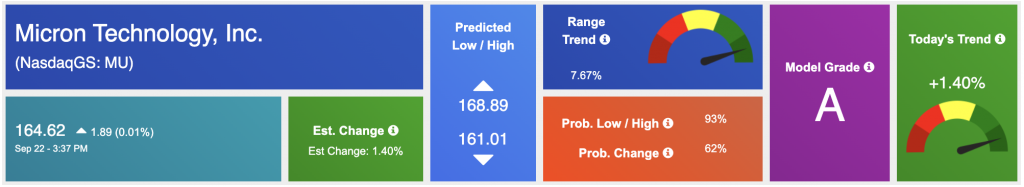
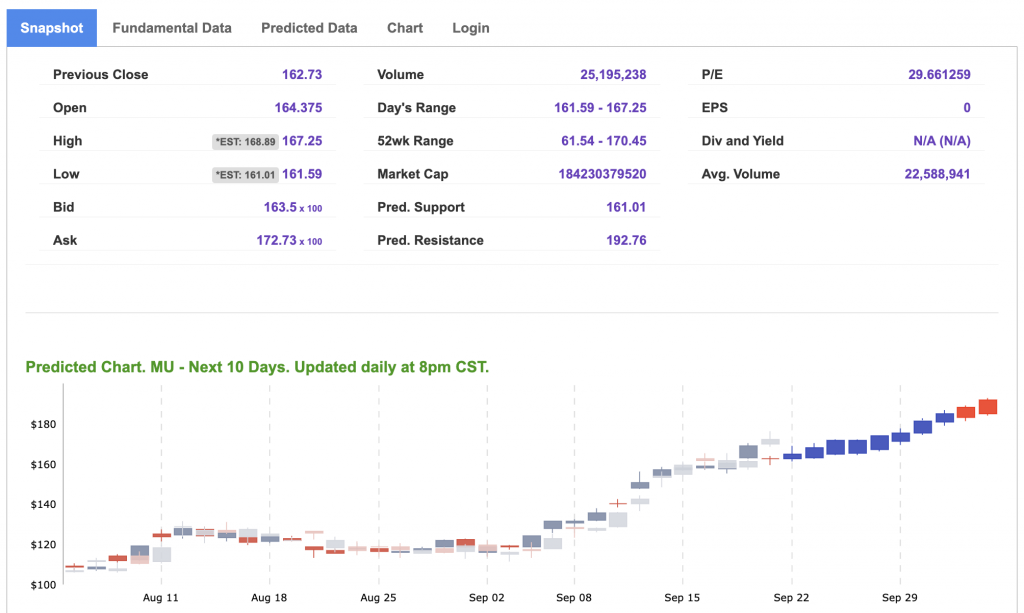
Our featured symbol for Tuesday is MU. Micron Technologies Inc. is showing a steady vector in our Stock Forecast Toolbox’s 10-day forecast.
The symbol is trading at $164.62 with a vector of +1.40% at the time of publication.
10-Day Prediction data is uploaded after the market close at 6 p.m., CST. Today’s data is based on market signals from the previous trading session.
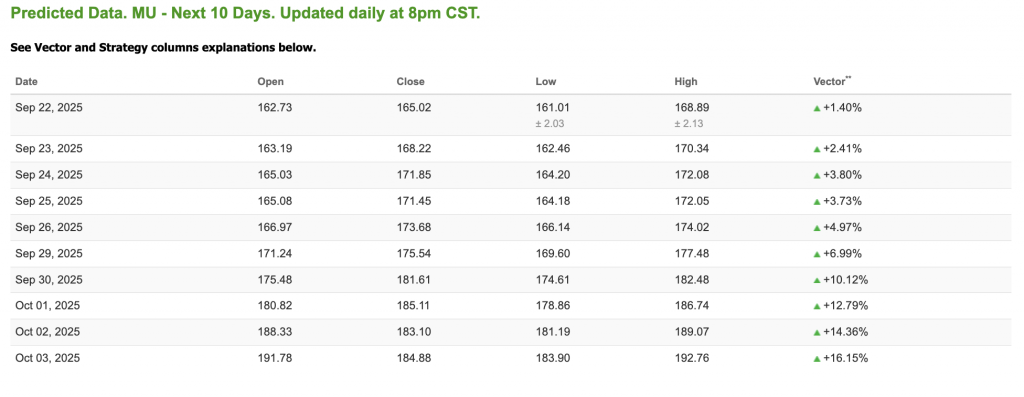
Note: The Vector column calculates the change of the Forecasted Average Price for the next trading session relative to the average of actual prices for the last trading session. The column shows the expected average price movement “Up or Down”, in percent. Trend traders should trade along the predicted direction of the Vector. The higher the value of the Vector the higher its momentum.
*Please note: At the time of publication, Vlad Karpel does have a position in the featured symbol, mu. Our featured symbol is part of your free subscription service. It is not included in any paid Tradespoon subscription service. Vlad Karpel only trades his money in paid subscription services. If you are a paid subscriber, please review your Premium Member Picks, ActiveTrader, or MonthlyTrader recommendations. If you are interested in receiving Vlad’s picks, please click here.
West Texas Intermediate for Crude Oil delivery (CL.1) is priced at $62.64 per barrel, down 0.06%, at the time of publication.
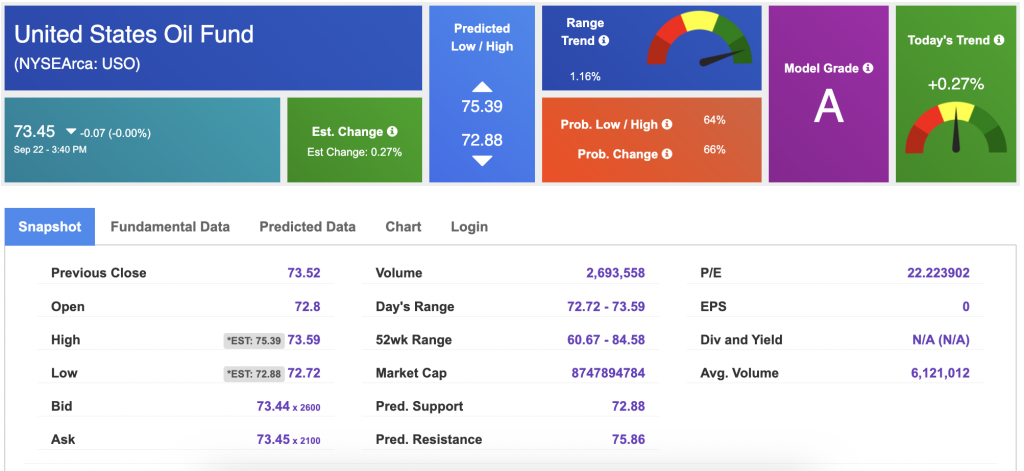
Looking at USO, a crude oil tracker, our 10-day prediction model shows mixed signals. The fund is trading at $73.45 at the time of publication. Prediction data is uploaded after the market close at 6 p.m., CST. Today’s data is based on market signals from the previous trading session.
The price for the Gold Continuous Contract (GC00) is up 2.07% at $3,782.50.00 at the time of publication.
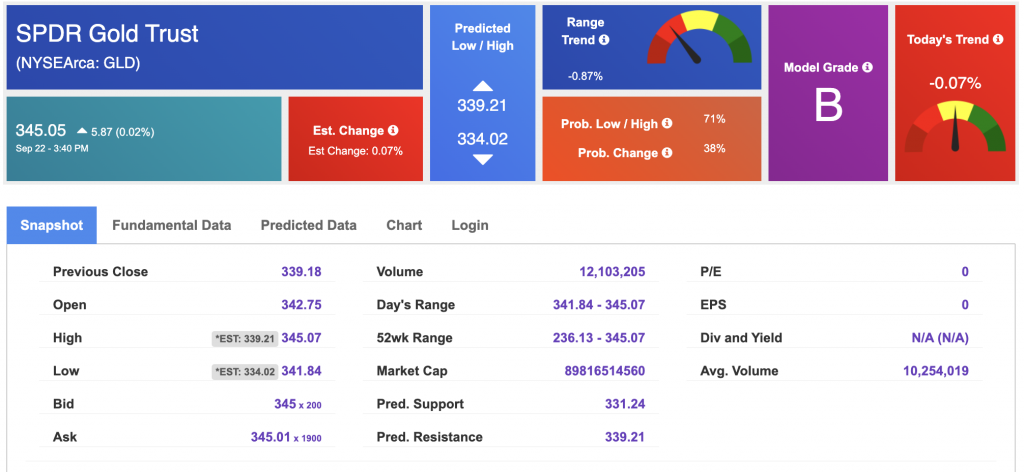
Using SPDR GOLD TRUST (GLD) as a tracker in our Stock Forecast Tool, the 10-day prediction window shows mixed signals. The gold proxy is trading at $345.05 at the time of publication. Vector signals show -0.07% for today. Prediction data is uploaded after the market close at 6 p.m., CST. Today’s data is based on market signals from the previous trading session.
The yield on the 10-year Treasury note is up at 4.152% at the time of publication.
The yield on the 30-year Treasury note is up at 4.766% at the time of publication.
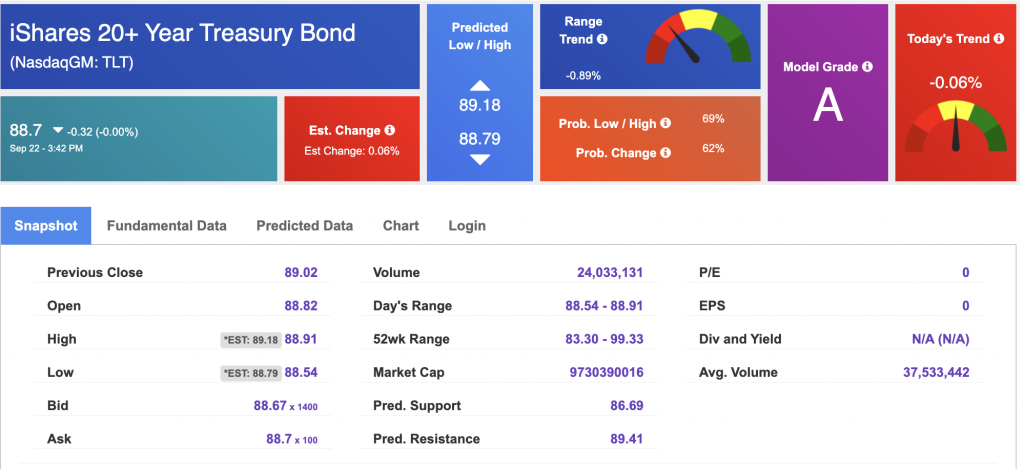
Using the iShares 20+ Year Treasury Bond ETF (TLT) as a proxy for bond prices in our Stock Forecast Tool, we see mixed signals in our 10-day prediction window. Prediction data is uploaded after the market close at 6 p.m., CST. Today’s data is based on market signals from the previous trading session.
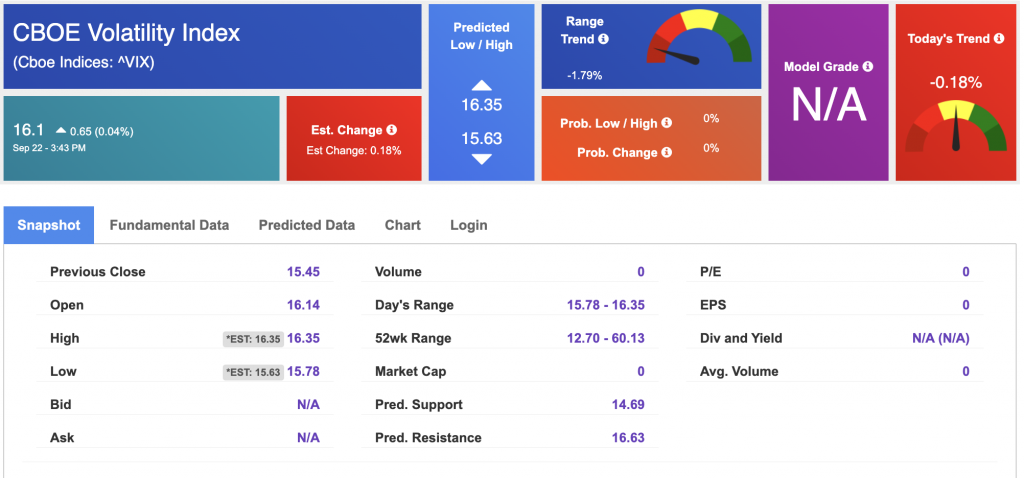
The CBOE Volatility Index (^VIX) is priced at $16.2 at the time of publication, and our 10-day prediction window shows mixed signals. Prediction data is uploaded after the market close at 6 p.m., CST. Today’s data is based on market signals from the previous trading session.
Please share this Tradespoon Market Commentary with your friends.
![]()

![]()
Comments Off on


Tradespoon Tools make finding winning trades in minute as easy as 1-2-3.
Our simple 3 step approach has resulted in an average return of almost 20% per trade!

