 Special Offer: Try the 'RoboInvestor Membership' for ONLY $37!
CLICK HERE TO LEARN MORE
Special Offer: Try the 'RoboInvestor Membership' for ONLY $37!
CLICK HERE TO LEARN MORE
After a week of dizzying contradictions, U.S. markets entered Monday trading higher, flirting with record territory even as investors stared down a gauntlet of risks. Wall Street’s current state is a portrait of tension: euphoric tech rallies and diplomatic whispers keep prices elevated, but the economic foundation is cracking beneath the surface.
Last week, the S&P 500 posted its strongest gain since 2023, led by megacap tech stocks and a perception, however temporary, that U.S.-China trade relations were stabilizing. Yet beneath the surface, the data told a different story. Both manufacturing and service activity slipped into contraction. Labor market growth slowed sharply, and fears of a tariff-fueled inflationary resurgence grew louder. And while Friday’s stronger-than-expected jobs report injected a dose of optimism, the longer-term narrative remains mixed at best.
The biggest driver of both volatility and speculation remains tariffs. Monday’s much-anticipated trade talks between top U.S. and Chinese officials in London turned markets cautious after an early rally. Stocks reversed course mid-morning as traders monitored headlines from the closed-door negotiations. President Trump’s recent tariff moves—first doubling rates on steel and aluminum, then pausing aggressive new levies on EU imports—have become the central narrative driving inflation expectations and equity sentiment alike.
The administration’s sudden dialing back of April’s 145% tariff on Chinese imports—cut to 30% in May—helped spark a late-month rebound in consumer sentiment and a rally in equities. Now, the market is betting that the bluster was part of a broader negotiating tactic. But that bet is far from secure.
Trump’s Friday tweet referencing a “very good” call with President Xi, along with a thaw in rhetoric with Elon Musk after their spat rattled Tesla stock last week, gave bulls some relief. Still, with the reciprocal tariff pause set to expire on July 8, headline risk remains extreme. Traders and policymakers alike are bracing for what could come next—and what it might cost.
Tech continues to drive the equity rally, though not uniformly. Nvidia, Meta, and Broadcom extended gains last week, reinforcing AI’s role as the primary engine behind market upside. Broadcom’s 46% YoY jump in AI networking revenue bolstered investor confidence in infrastructure names positioned to benefit from long-term machine learning adoption.
Apple, once a reliable pillar of strength, has faltered. Its Worldwide Developers Conference opened Monday under a cloud, with Wall Street increasingly skeptical of Apple’s delayed AI rollout and lagging innovation in Siri. Shares are down 19% this year, and Monday’s modest decline suggests skepticism is outweighing loyalty, even among its two-billion-device user base.
Apple’s AI ambitions face structural headwinds: its commitment to privacy limits its ability to leverage cloud-based models, a competitive disadvantage in an Nvidia-dominated world. And while the company’s on-device AI remains secure and private, it has so far underwhelmed in performance. Apple may eventually catch up—as it has in the past—but for now, its absence from the AI leadership group is becoming more glaring.
The underlying economy is growing more brittle. Last week’s ADP report showed just 37,000 private-sector jobs added in May—the weakest print in over two years. Simultaneously, ISM Services PMI slipped to 49.9, confirming contraction for the first time in nearly a year. Paired with a Manufacturing PMI of 48.5, this marked the first dual-sector contraction since early in the pandemic recovery.
Yet, Friday’s nonfarm payrolls surprised to the upside. That relief rally pushed the Dow up 550 points at the open, with the S&P and Nasdaq posting strong gains. However, most job gains came from lower-wage industries—healthcare, hospitality—while white-collar and industrial hiring remained tepid.
Treasury yields mirrored the market’s schizophrenia. The 10-year yield bounced back to 4.47% by week’s end after falling earlier on growth concerns. Meanwhile, the VIX hovered near 17, subdued but watchful. The bond market appears to be pricing in a higher-for-longer interest rate regime, while equities cling to the hope of a soft landing driven by AI and diplomacy.
Wednesday and Thursday bring two crucial inflation reports—CPI and PPI for May. Economists expect a slight uptick in headline CPI from April’s 2.3%, driven in part by tariff pressures and energy costs. Still, expectations for rate cuts remain subdued. The Fed is widely expected to leave rates unchanged at next week’s FOMC meeting, but the outlook it delivers may significantly shift market sentiment.
Inflation expectations, once surging, have stabilized thanks to the May tariff rollback. But the risk remains that any re-escalation in trade tensions could revive inflation fears and further compress the Fed’s policy flexibility. For now, the Fed’s dual mandate is pulling in opposite directions—growth is slowing, but inflation remains sticky.
Bitcoin continued its strong run, trading above $107,000 as digital assets gained ground on a weakening dollar. Meanwhile, the U.S. Dollar Index edged lower again Monday, reflecting the market’s shifting sentiment around global risk and policy divergence.
Oil, which posted its best week of the year last week, faces downside risk again. S&P Global Commodity Insights warned prices could fall below $50 per barrel later this year as OPEC supply floods the market. Brent crude’s recent climb to $66.47 may prove temporary if demand slows and inventories build.
Gold, despite its headline-grabbing surge earlier in 2025, has now moved largely sideways since April, stuck between $3,187 and $3,419 per ounce. The metal’s pause reflects a broader truth—investors are unsure whether to fear inflation, recession, or geopolitical instability most. That indecision is showing up in every corner of the market.
One of the biggest surprises on Monday came from Warner Bros. Discovery, which announced a tax-free split into two public entities: one for streaming and studios (including HBO Max), and the other for traditional cable networks like CNN and TNT. While the stock popped on the news, analysts remain skeptical. Cord-cutting continues to erode legacy media revenues, and Warner’s cable unit posted a 15% year-over-year EBITDA decline last quarter.
Other media giants like Comcast and potentially Paramount are following similar paths, but in a slowing economy with rising consumer pressure, unbundling may not solve the core challenge: there’s simply less discretionary income available for streaming.
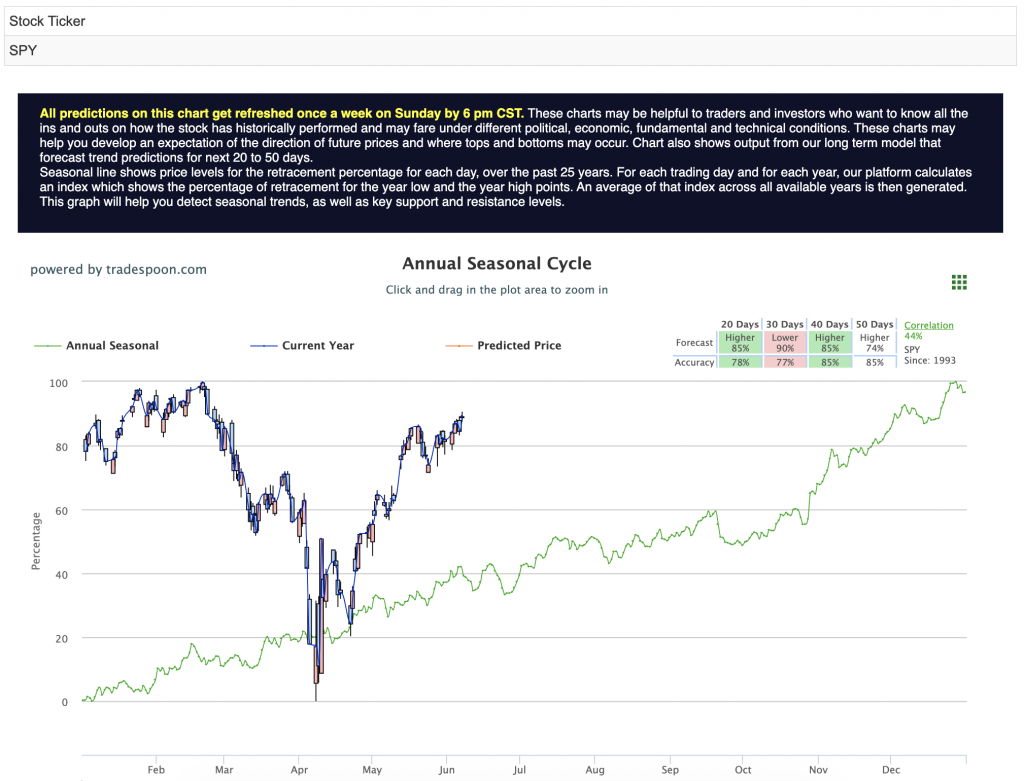
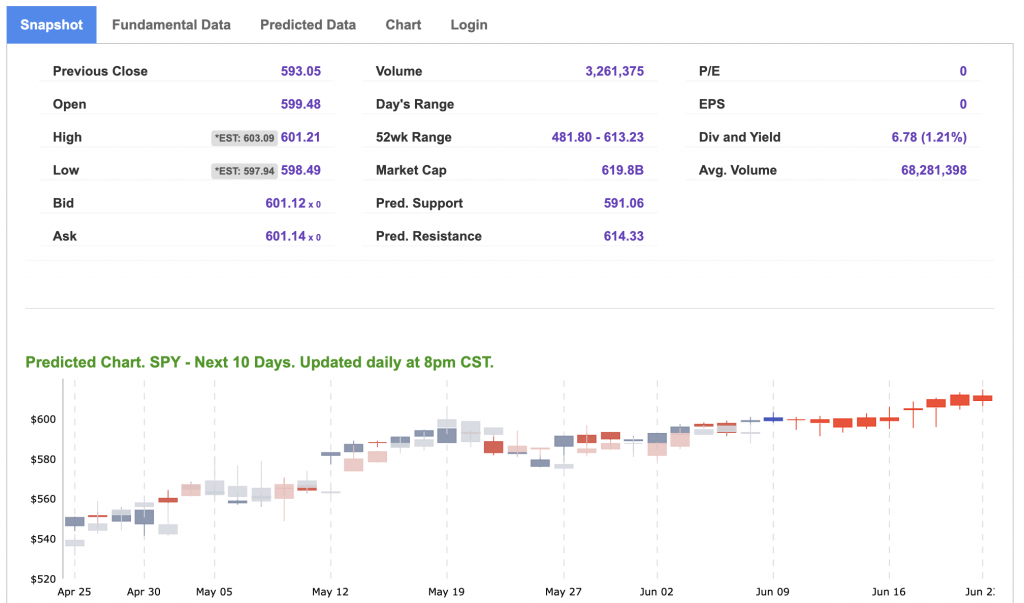
Despite the recent gains, we remain in a market-neutral stance. The SPY continues to show strength with upside potential toward the $600–$620 range, but downside support remains firm at $540–$550. The short-term path likely stays sideways, with summer volatility simmering under the surface. Long-term trends are increasingly under pressure. For reference, the SPY Seasonal Chart is shown below:
Recession odds are climbing. Tariffs are distorting inflation expectations. And unemployment is inching higher. AI and diplomacy may be holding the market aloft for now, but the weight of economic fatigue is growing. Investors should proceed with caution—optimism is not the same as immunity.
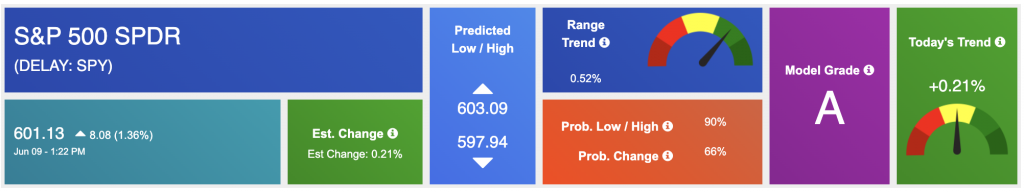
Using the “SPY” symbol to analyze the S&P 500, our 10-day prediction window shows a near-term positive outlook. Prediction data is uploaded after the market closes at 6 p.m. CST. Today’s data is based on market signals from the previous trading session.
Our featured symbol for Tuesday is NVDA. Nvidia Corp. – NVDA is showing a steady vector in our Stock Forecast Toolbox’s 10-day forecast.
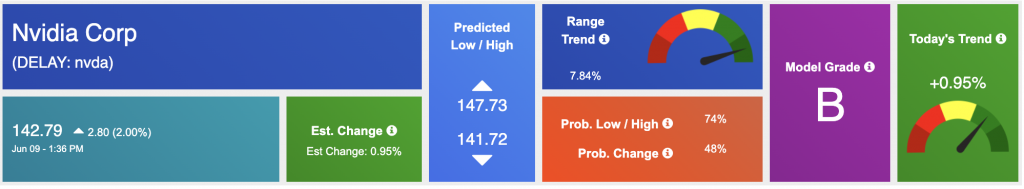
The symbol is trading at $142.79 with a vector of +0.95% at the time of publication.
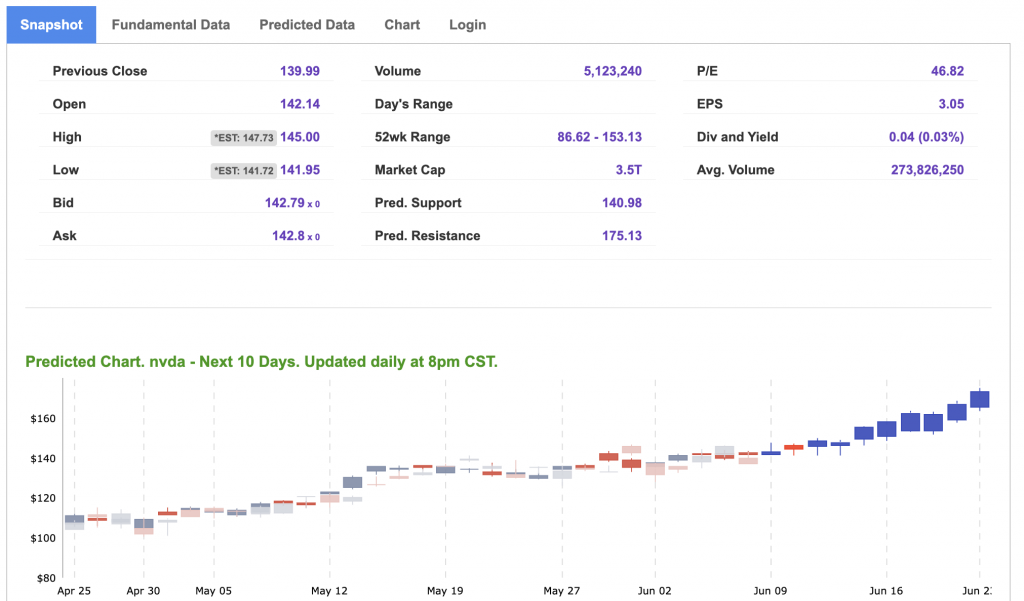
10-Day Prediction data is uploaded after the market close at 6 p.m., CST. Today’s data is based on market signals from the previous trading session.
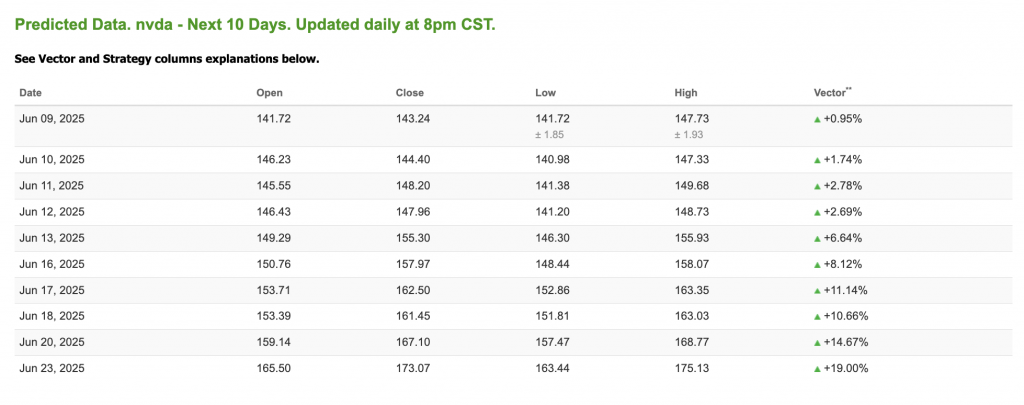
Note: The Vector column calculates the change of the Forecasted Average Price for the next trading session relative to the average of actual prices for the last trading session. The column shows the expected average price movement “Up or Down”, in percent. Trend traders should trade along the predicted direction of the Vector. The higher the value of the Vector the higher its momentum.
*Please note: At the time of publication, Vlad Karpel does have a position in the featured symbol, NVDA. Our featured symbol is part of your free subscription service. It is not included in any paid Tradespoon subscription service. Vlad Karpel only trades his money in paid subscription services. If you are a paid subscriber, please review your Premium Member Picks, ActiveTrader, or MonthlyTrader recommendations. If you are interested in receiving Vlad’s picks, please click here.
West Texas Intermediate for Crude Oil delivery (CL.1) is priced at $65.37 per barrel, up 1.22%, at the time of publication.
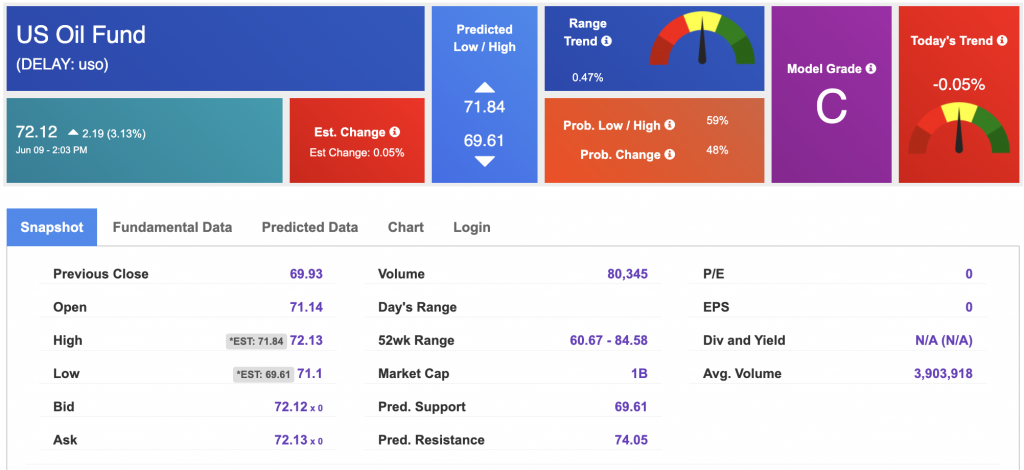
Looking at USO, a crude oil tracker, our 10-day prediction model shows mixed signals. The fund is trading at $72.12 at the time of publication. Prediction data is uploaded after the market close at 6 p.m., CST. Today’s data is based on market signals from the previous trading session.
The price for the Gold Continuous Contract (GC00) is up 0.25% at $3,355.10 at the time of publication.
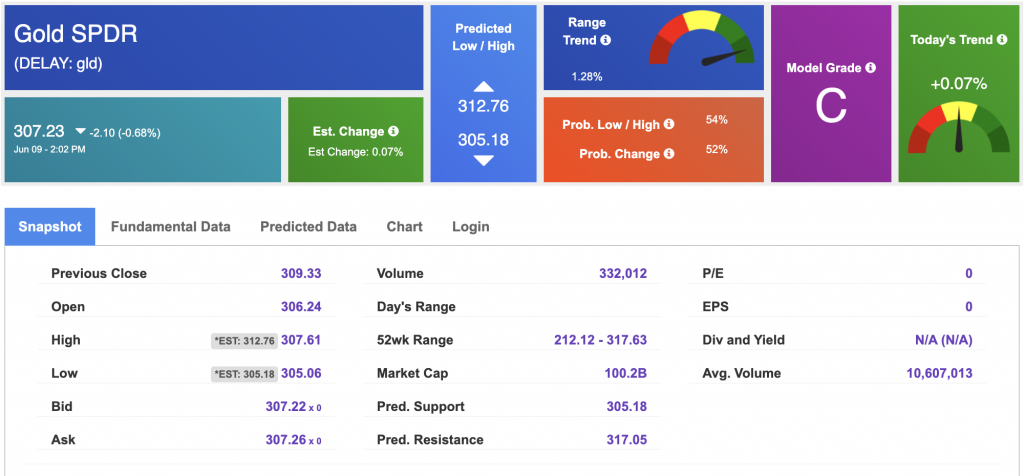
Using SPDR GOLD TRUST (GLD) as a tracker in our Stock Forecast Tool, the 10-day prediction window shows mixed signals. The gold proxy is trading at $307.23 at the time of publication. Vector signals show +0.07% for today. Prediction data is uploaded after the market close at 6 p.m., CST. Today’s data is based on market signals from the previous trading session.
The yield on the 10-year Treasury note is down at 4.486% at the time of publication.
The yield on the 30-year Treasury note is down at 4.959% at the time of publication.
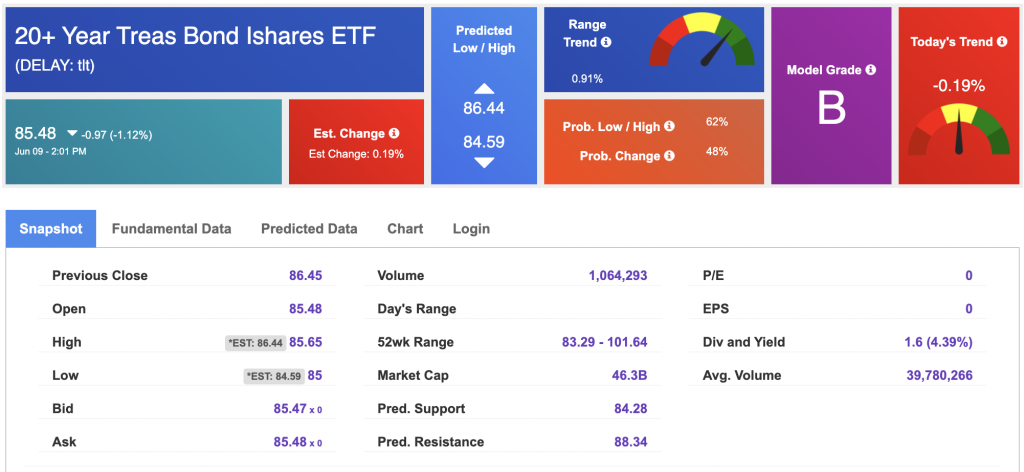
Using the iShares 20+ Year Treasury Bond ETF (TLT) as a proxy for bond prices in our Stock Forecast Tool, we see mixed signals in our 10-day prediction window. Prediction data is uploaded after the market close at 6 p.m., CST. Today’s data is based on market signals from the previous trading session.
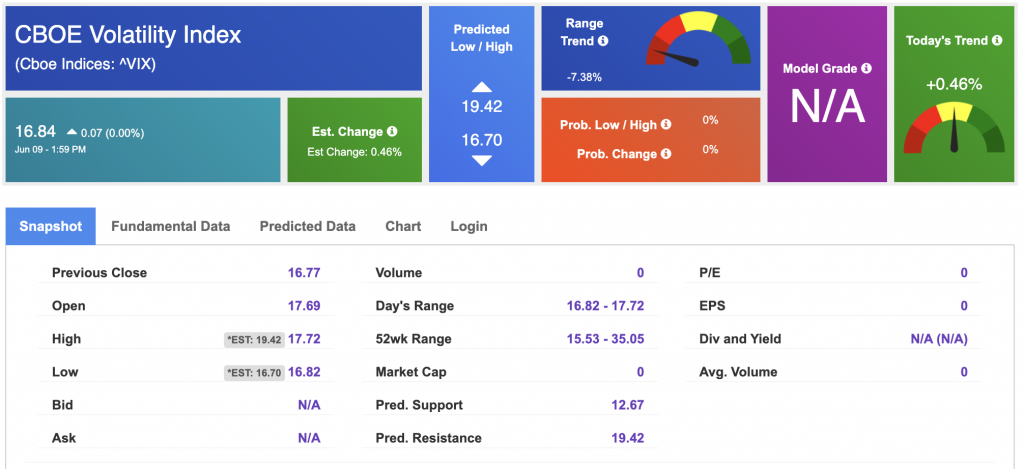
The CBOE Volatility Index (^VIX) is priced at $16.84 at the time of publication, and our 10-day prediction window shows mixed signals. Prediction data is uploaded after the market close at 6 p.m., CST. Today’s data is based on market signals from the previous trading session.
Please share this Tradespoon Market Commentary with your friends.
![]()

![]()
Comments Off on


Tradespoon Tools make finding winning trades in minute as easy as 1-2-3.
Our simple 3 step approach has resulted in an average return of almost 20% per trade!