 Special Offer: Try the 'Picks Membership' for ONLY $37!
CLICK HERE TO LEARN MORE
Special Offer: Try the 'Picks Membership' for ONLY $37!
CLICK HERE TO LEARN MORE
The U.S. stock market showed resilience this week despite Moody’s decision to downgrade U.S. sovereign debt and a mixed set of economic reports. On Friday, Moody’s cut the rating on U.S. debt from Aaa to Aa1, spiking Treasury yields and initially sending stocks lower. The Dow Jones Industrial Average dropped by 281 points, or 0.7%, while the Nasdaq Composite fell 1.4%, and the S&P 500 declined by 1%. This marked the end of a five-day rally, but markets quickly shook off the news, with broader sentiment stabilizing through the week.
Investor sentiment has been a balancing act between global trade developments and inflationary pressures, with the market showing signs of cautious optimism amidst ongoing concerns about economic growth and the future trajectory of interest rates.
A key catalyst for market movement last week was the announcement of a temporary U.S.-China trade agreement, which saw the U.S. and China agreeing to a 90-day reprieve on reciprocal tariffs. This move alleviated some fears of an escalating trade war, driving investor confidence. However, this optimism began to fade by Tuesday as investors grew cautious, awaiting further clarity on the sustainability of the trade truce. In the backdrop, ongoing macroeconomic data and corporate earnings updates kept the market on edge.
Also last week, corporate earnings showed mixed results. American Eagle (AEO) dropped over 11% after warning of weak first-quarter earnings and withdrawing its 2025 outlook, highlighting concerns in the retail sector. UnitedHealth (UNH) fell more than 12% after suspending its forecast due to rising medical costs and leadership changes, dragging down healthcare peers like Humana (HUM) and CVS (CVS).
On the flip side, Coinbase (COIN) surged 9% after being added to the S&P 500, marking a milestone for the cryptocurrency industry. The broader market reflected these moves, with tech benefiting from trade optimism while healthcare and retail struggled.
The April Consumer Price Index (CPI) showed softer-than-expected inflation at 0.3% month-over-month, bringing the annual rate to 2.3%, the lowest in four years. This fueled hopes for potential Fed rate cuts. However, core inflation remained high at 2.8%, and the Producer Price Index (PPI) showed a 0.5% monthly increase, raising doubts about the Fed’s next steps.
The bond market reacted to the mixed signals, with the 10-year Treasury yield fluctuating as inflation expectations shifted. Gold, traditionally a safe haven, posted a near 4% weekly loss as investor focus moved back to risk assets amid easing trade tensions.
While U.S. markets faced volatility, European stocks have outperformed this year, buoyed by optimism in light of easing trade tensions, despite some challenges in the eurozone’s growth outlook. The European Commission lowered its growth forecast for the region but still anticipates a 0.9% increase in GDP for 2025, up from 0.4% in 2024. This relative strength in European markets could continue, even with the looming risks of U.S. tariffs.
Despite the recent market gyrations, the long-term trend remains under pressure, with several factors continuing to weigh on investor sentiment. The VIX, a volatility index, has remained relatively stable around 17, suggesting that uncertainty is still present but not extreme. The key risks for the market include the potential for a prolonged period of high interest rates, as the Federal Reserve grapples with inflation, and the increasing likelihood of a recession. Unemployment rates, while still low, have been ticking upward, further contributing to concerns about economic slowdown.
The S&P 500’s rally in recent weeks has been mostly driven by a narrow group of mega-cap technology stocks, with fewer than 120 names in the index posting positive returns. Sectors such as healthcare, retail, and utilities have lagged behind, with the healthcare sector particularly struggling due to issues at companies like UnitedHealth and CVS.
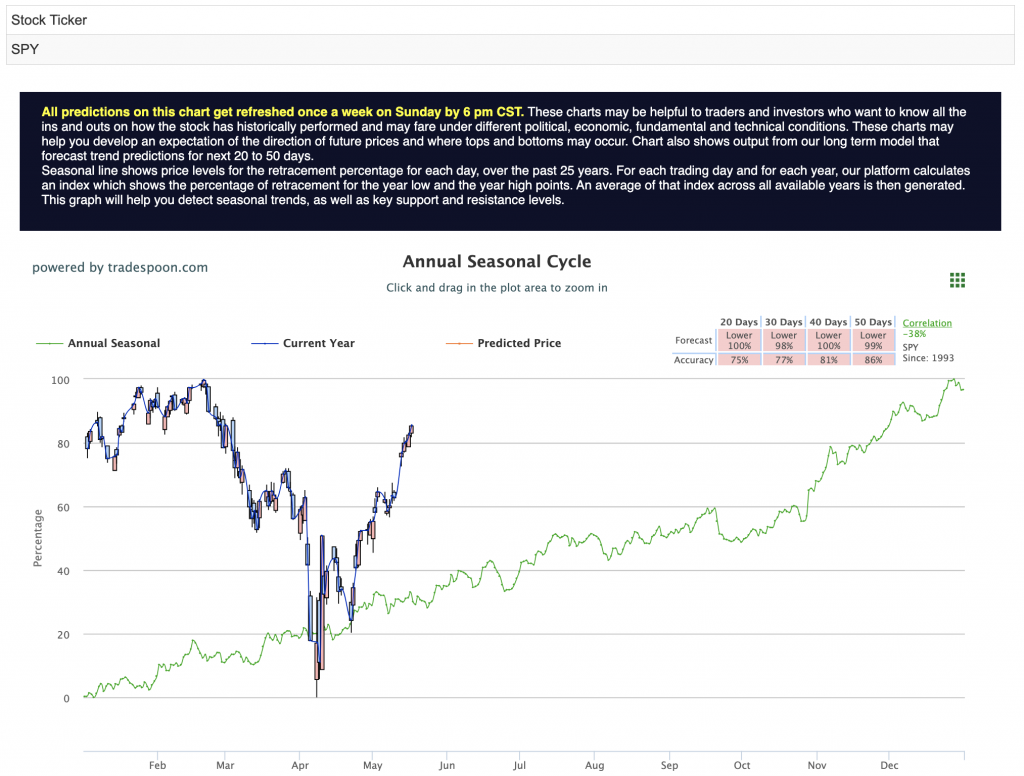
Looking forward, I remain in a market-neutral stance, with expectations for the market to continue trading sideways in the short term. The SPY (S&P 500 ETF) may test resistance levels between $600 and $620 if the rally extends, but short-term support remains in the $540–$550 range. A more significant catalyst, such as clearer signals from the Federal Reserve regarding rate cuts or a resolution in global trade tensions, could provide the momentum needed to push the market higher. For reference, the SPY Seasonal Chart is shown below:
For now, investors should remain vigilant as market conditions evolve. The uncertainty around inflation, trade, and the potential for a recession makes it crucial to stay diversified and agile, capitalizing on opportunities while managing risk.
The coming weeks will be critical, with Federal Reserve speeches, housing data, and PMI reports all set to provide fresh insights into the economic landscape. Additionally, corporate earnings reports will continue to shape sentiment, offering a clearer picture of consumer resilience and the pressures companies are facing in this uncertain environment.
As always, investors should balance short-term opportunities with long-term strategic positioning, staying informed and ready to adapt to changing conditions.
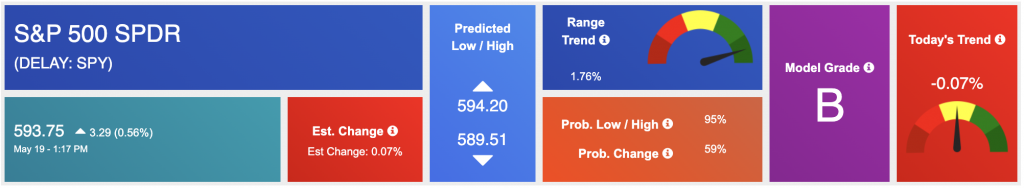
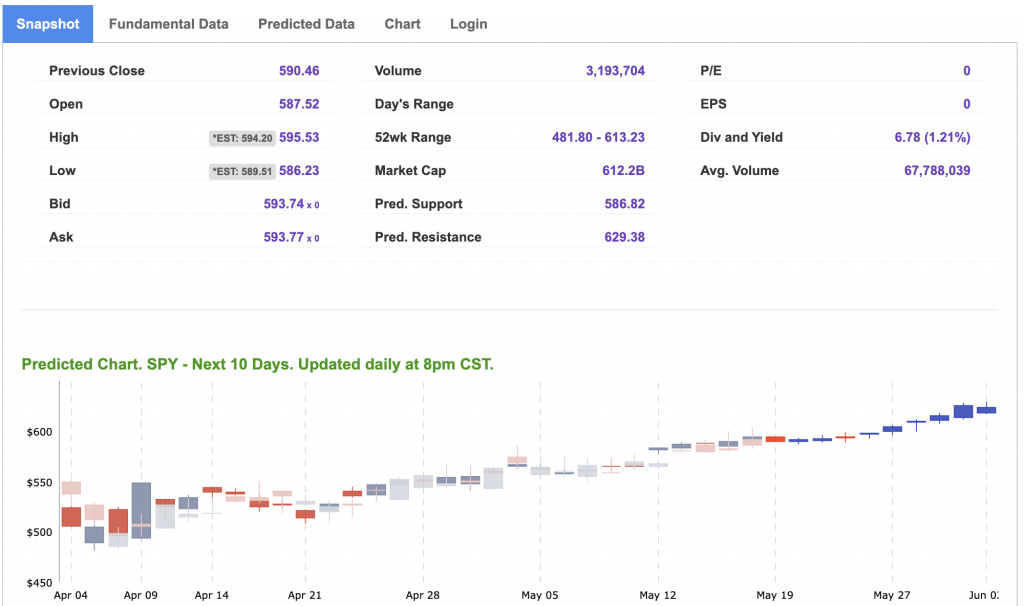
Using the “SPY” symbol to analyze the S&P 500, our 10-day prediction window shows a near-term positive outlook. Prediction data is uploaded after the market closes at 6 p.m. CST. Today’s data is based on market signals from the previous trading session.
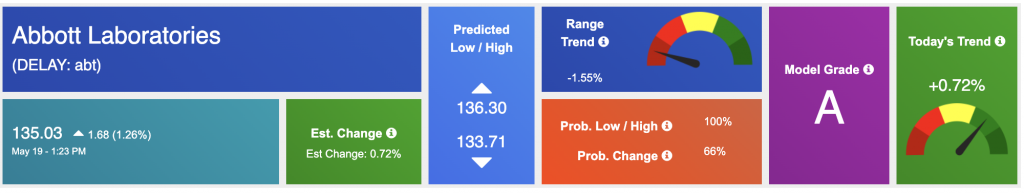
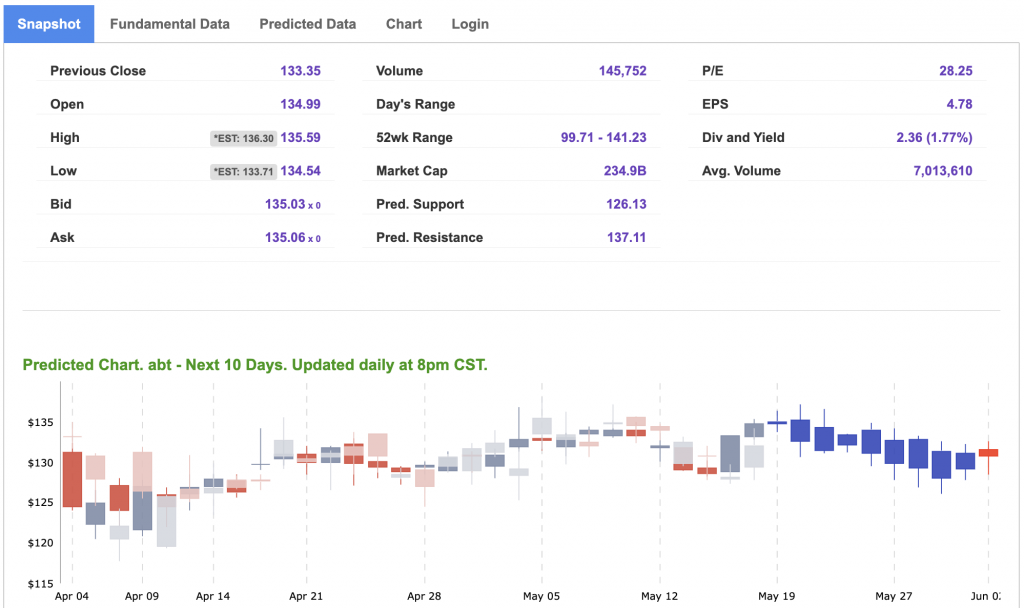
Our featured symbol for Tuesday is ABT. Abbott Laboratories – ABT is showing a steady vector in our Stock Forecast Toolbox’s 10-day forecast.
The symbol is trading at $135.03 with a vector of +0.72% at the time of publication.
10-Day Prediction data is uploaded after the market close at 6 p.m., CST. Today’s data is based on market signals from the previous trading session.
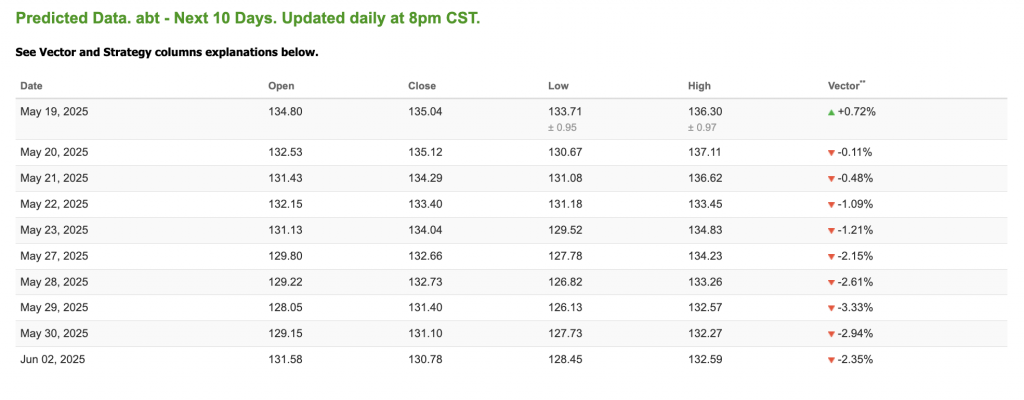
Note: The Vector column calculates the change of the Forecasted Average Price for the next trading session relative to the average of actual prices for the last trading session. The column shows the expected average price movement “Up or Down”, in percent. Trend traders should trade along the predicted direction of the Vector. The higher the value of the Vector the higher its momentum.
*Please note: At the time of publication, Vlad Karpel does have a position in the featured symbol, abt. Our featured symbol is part of your free subscription service. It is not included in any paid Tradespoon subscription service. Vlad Karpel only trades his money in paid subscription services. If you are a paid subscriber, please review your Premium Member Picks, ActiveTrader, or MonthlyTrader recommendations. If you are interested in receiving Vlad’s picks, please click here.
West Texas Intermediate for Crude Oil delivery (CL.1) is priced at $62.46 per barrel, down 0.05%%, at the time of publication.
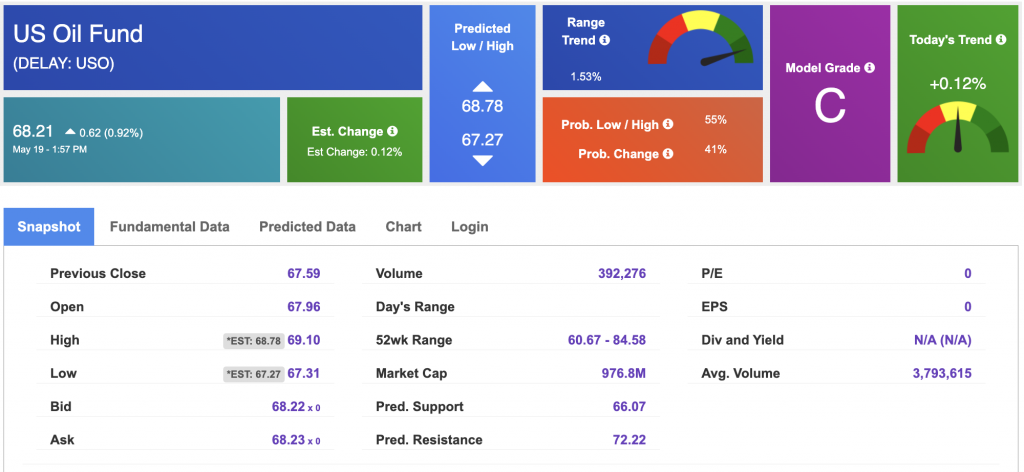
Looking at USO, a crude oil tracker, our 10-day prediction model shows mixed signals. The fund is trading at $68.21 at the time of publication. Prediction data is uploaded after the market close at 6 p.m., CST. Today’s data is based on market signals from the previous trading session.
The price for the Gold Continuous Contract (GC00) is up 1.56% at $3,236.90 at the time of publication.
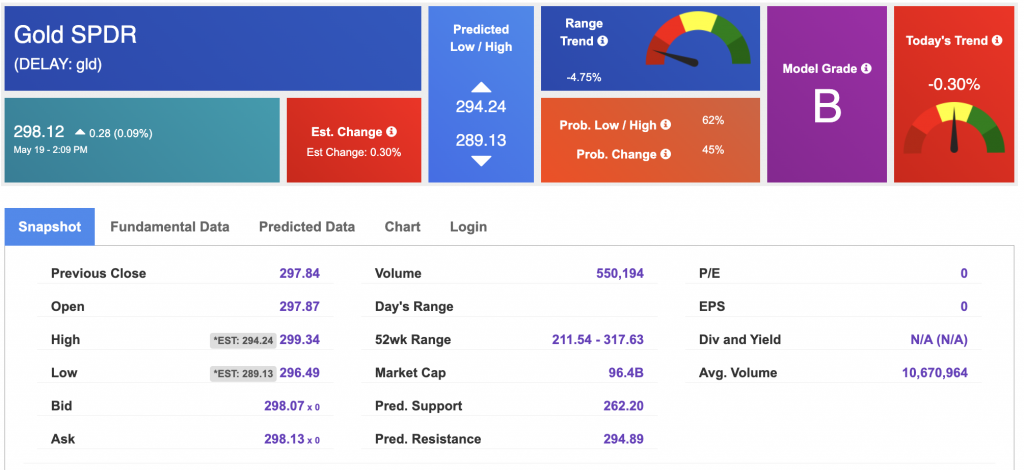
Using SPDR GOLD TRUST (GLD) as a tracker in our Stock Forecast Tool, the 10-day prediction window shows mixed signals. The gold proxy is trading at $298.12 at the time of publication. Vector signals show -0.30% for today. Prediction data is uploaded after the market close at 6 p.m., CST. Today’s data is based on market signals from the previous trading session.
The yield on the 10-year Treasury note is down at 4.460% at the time of publication.
The yield on the 30-year Treasury note is down at 4.921% at the time of publication.
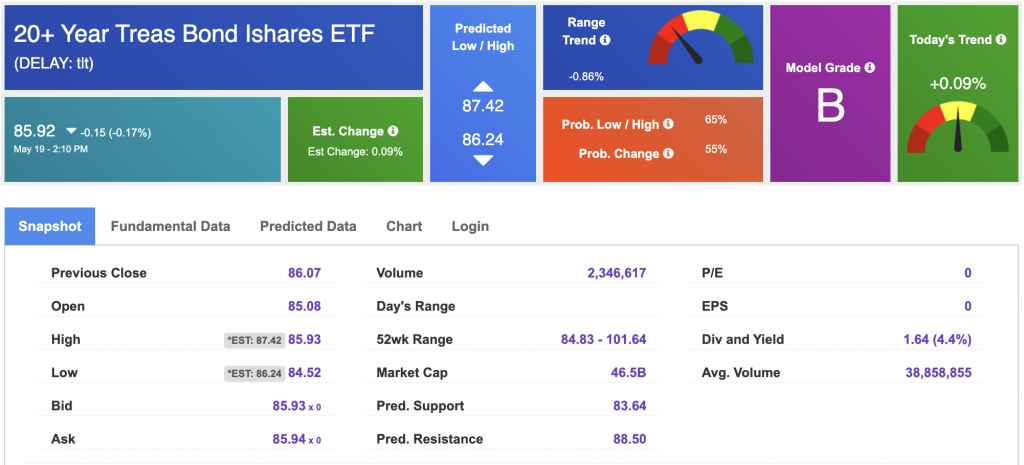
Using the iShares 20+ Year Treasury Bond ETF (TLT) as a proxy for bond prices in our Stock Forecast Tool, we see mixed signals in our 10-day prediction window. Prediction data is uploaded after the market close at 6 p.m., CST. Today’s data is based on market signals from the previous trading session.
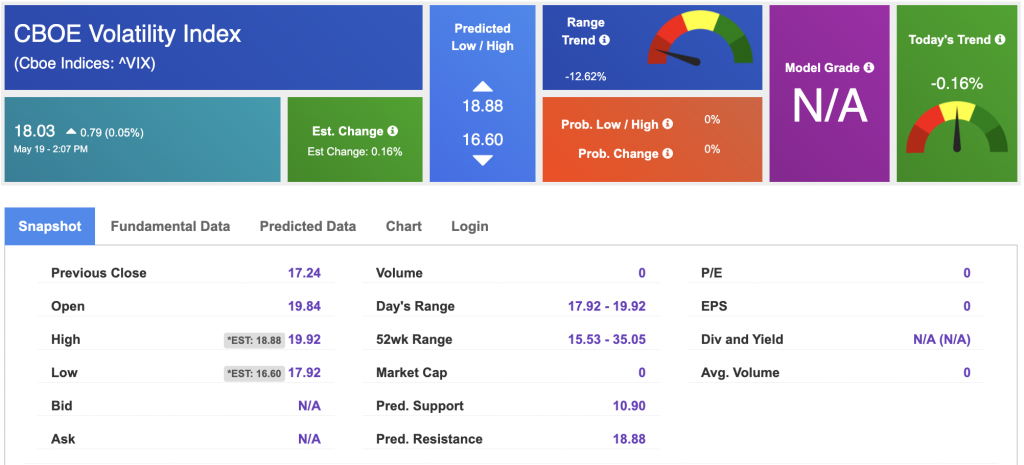
The CBOE Volatility Index (^VIX) is priced at $18.93 at the time of publication, and our 10-day prediction window shows mixed signals. Prediction data is uploaded after the market close at 6 p.m., CST. Today’s data is based on market signals from the previous trading session.
Please share this Tradespoon Market Commentary with your friends.
![]()

![]()
Comments Off on


Tradespoon Tools make finding winning trades in minute as easy as 1-2-3.
Our simple 3 step approach has resulted in an average return of almost 20% per trade!