 Special Offer: Try the 'Forecast Toolbox Membership' for ONLY $37!
CLICK HERE TO LEARN MORE
Special Offer: Try the 'Forecast Toolbox Membership' for ONLY $37!
CLICK HERE TO LEARN MORE
As the calendar flipped to June, the stock market continued its recent pattern of short-lived optimism interrupted by sobering economic and geopolitical headlines. What began as a weak and uncertain start to the week turned into a modest win for bulls by Monday’s close, but the underlying message from Wall Street remains one of caution, not conviction.
The Dow, S&P 500, and Nasdaq managed to inch higher by 0.1%, 0.4%, and 0.7%, respectively, recovering from morning losses thanks to late-session buying in heavyweight tech stocks. Nvidia led the charge with a 1.7% gain, while Meta Platforms staged an impressive reversal to end the day up 3.6%.
These gains came despite escalating friction between the U.S. and China. Both nations traded accusations of violating their tariff truce, reigniting fears of a renewed trade war just as a federal court ruled many of Trump’s previous tariff hikes illegal. Markets had already shown sensitivity to this narrative late last week, when President Trump’s social media accusations triggered a selloff heading into the weekend.
Bond markets continued flashing warning signs. The 30-year Treasury yield briefly breached the 5% threshold before settling at 4.993%, reflecting investor skittishness around rate policy and long-term inflation. The 10-year yield closed last week at 4.43%, while the 2-year fell to 3.94%, signaling rising uncertainty about the Fed’s path forward. Though April’s PCE inflation reading was soft—up just 0.1% month-over-month and 2.1% year-over-year—markets are no longer convinced that a slowdown in price growth alone will prompt rate cuts.
Oil prices also saw a volatile session, surging nearly 5% before fading into the close, adding further pressure to inflation-sensitive sectors and reinforcing the sense that any market rally remains on a shaky foundation.
The latest economic data didn’t provide much reassurance. The ISM Manufacturing PMI fell to 48.5 in May, below the expected 49.5 and marking the third straight month of contraction. Though the new orders index ticked up slightly from April’s level, it remained in contraction territory at 47.6. Terms like “tariff uncertainty,” “price increases,” and “supply chain disruptions” were scattered across survey responses, echoing familiar concerns from the last few years.
Investors are also bracing for tomorrow’s release of the latest JOLTS report, which may offer more clues about the labor market’s trajectory. Unemployment appears to be inching higher, adding to recession fears already fueled by high rates and shaky consumer sentiment.
Despite decelerating inflation, investors are coming to terms with the likelihood that interest rates will stay higher for longer, particularly with Fed officials remaining cautious amid unresolved trade policy and softening growth metrics. The court ruling on Trump-era tariffs adds a new layer of complexity, potentially stalling rate cuts further and injecting legal uncertainty into already tense U.S.–China relations.
I remain firmly in the market-neutral camp. While a SPY rally toward the $600–620 zone is possible in the coming months, the probability of a broad upside breakout is limited unless inflation eases further, unemployment stabilizes, and trade risks cool down. For now, the base case remains a sideways market, shaped by fragile optimism, elevated volatility, and macro pressures that continue to simmer just beneath the surface.
The coming days will be pivotal, with labor market data, more Fed commentary, and corporate earnings from CrowdStrike, Dollar General, and GameStop offering potential catalysts. But until broader uncertainties resolve, patience, not prediction, may be the trader’s most valuable asset.
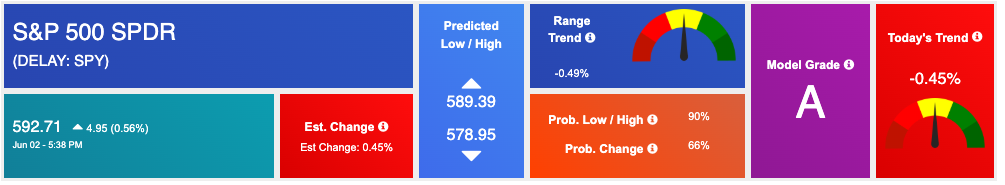
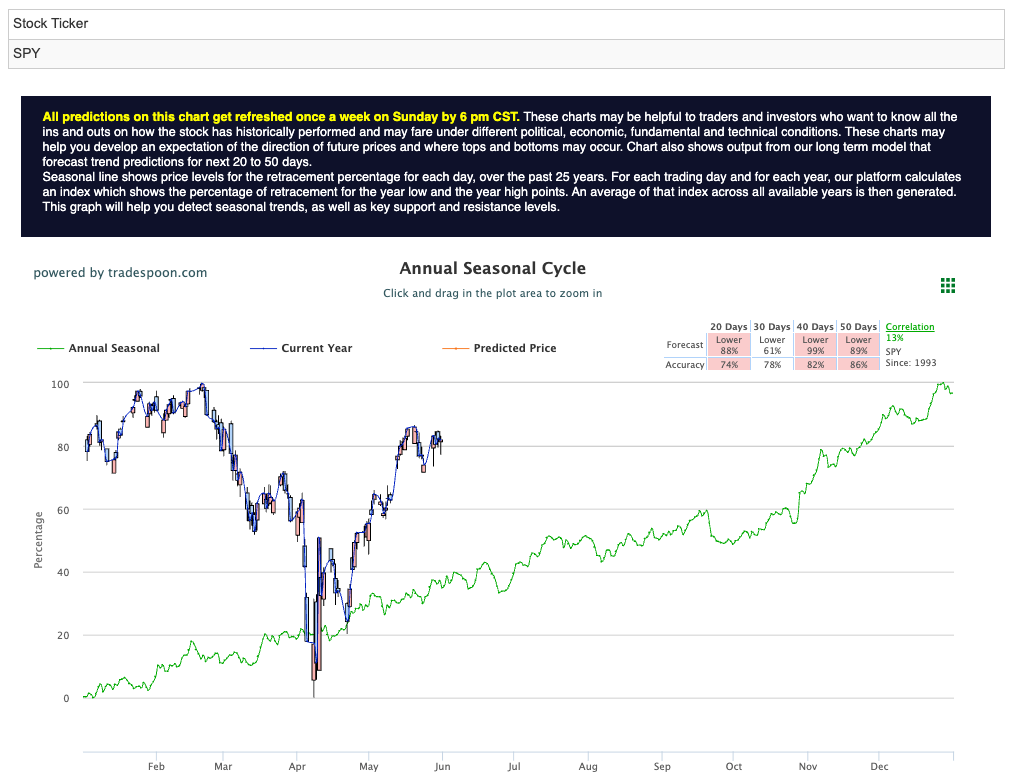
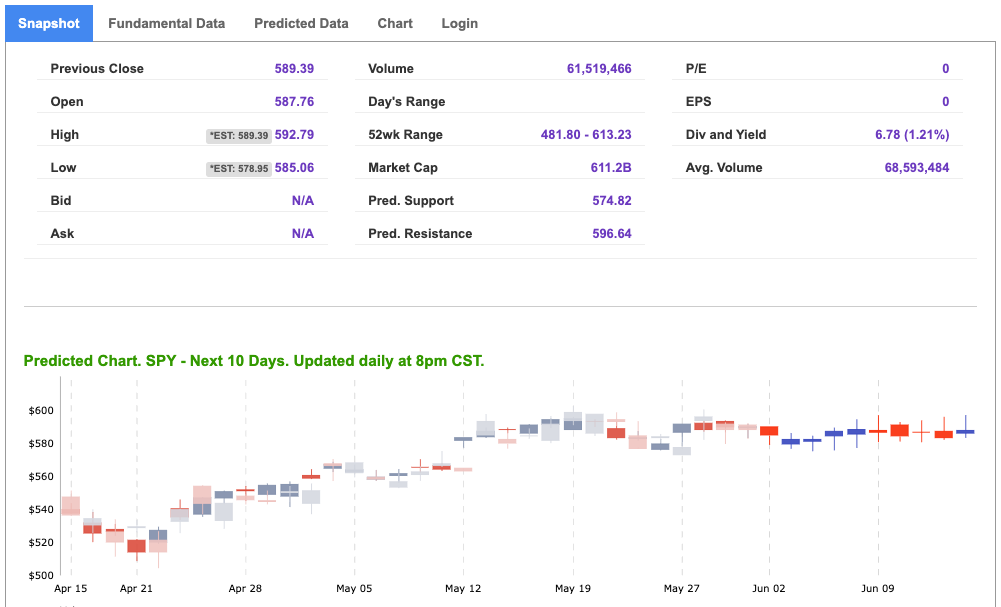
Using the “SPY” symbol to analyze the S&P 500, our 10-day prediction window shows a near-term positive outlook. Prediction data is uploaded after the market closes at 6 p.m. CST. Today’s data is based on market signals from the previous trading session.
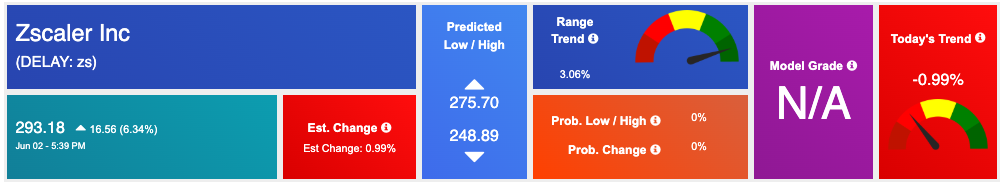
Our featured symbol for Tuesday is ZS. Zscaler Inc. – ZS is showing a steady vector in our Stock Forecast Toolbox’s 10-day forecast.
The symbol is trading at $135.03 with a vector of +0.72% at the time of publication.
10-Day Prediction data is uploaded after the market close at 6 p.m., CST. Today’s data is based on market signals from the previous trading session.
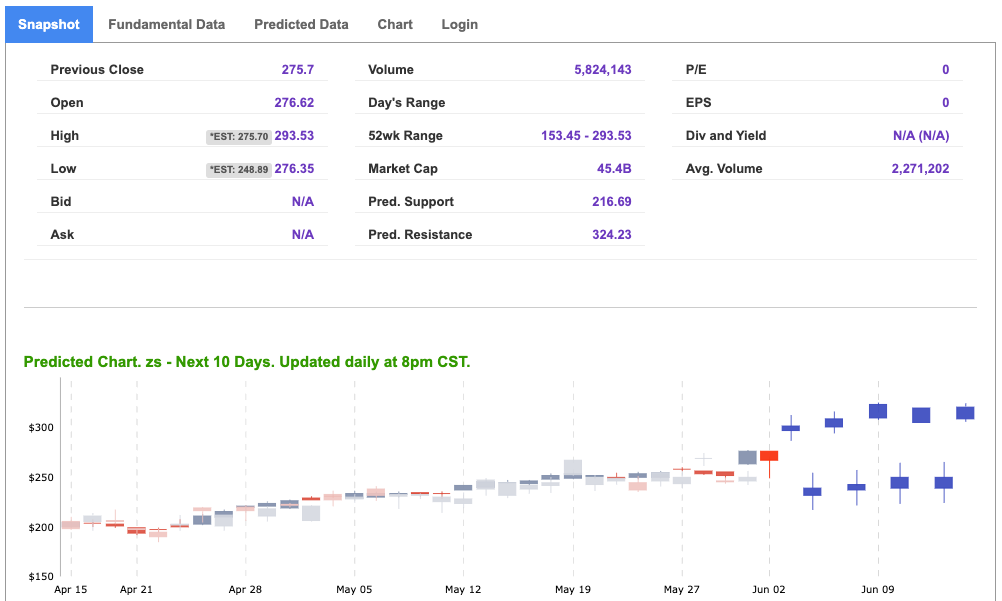
Note: The Vector column calculates the change of the Forecasted Average Price for the next trading session relative to the average of actual prices for the last trading session. The column shows the expected average price movement “Up or Down”, in percent. Trend traders should trade along the predicted direction of the Vector. The higher the value of the Vector the higher its momentum.
*Please note: At the time of publication, Vlad Karpel does have a position in the featured symbol, abt. Our featured symbol is part of your free subscription service. It is not included in any paid Tradespoon subscription service. Vlad Karpel only trades his money in paid subscription services. If you are a paid subscriber, please review your Premium Member Picks, ActiveTrader, or MonthlyTrader recommendations. If you are interested in receiving Vlad’s picks, please click here.
West Texas Intermediate for Crude Oil delivery (CL.1) is priced at $63.11 per barrel, up 0.91%%, at the time of publication.

Looking at USO, a crude oil tracker, our 10-day prediction model shows mixed signals. The fund is trading at $69.55 at the time of publication. Prediction data is uploaded after the market close at 6 p.m., CST. Today’s data is based on market signals from the previous trading session.
The price for the Gold Continuous Contract (GC00) is up 0.51% at $3,414.20 at the time of publication.
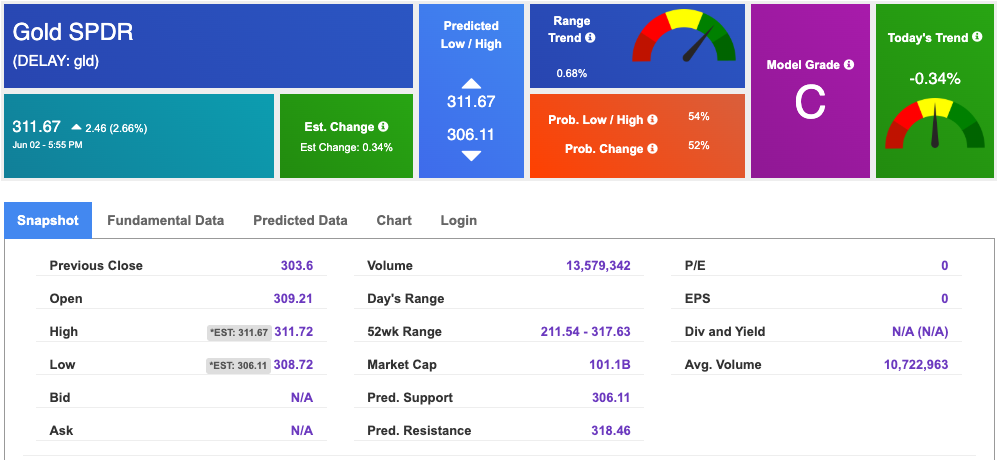
Using SPDR GOLD TRUST (GLD) as a tracker in our Stock Forecast Tool, the 10-day prediction window shows mixed signals. The gold proxy is trading at $311.67 at the time of publication. Vector signals show +0.34% for today. Prediction data is uploaded after the market close at 6 p.m., CST. Today’s data is based on market signals from the previous trading session.
The yield on the 10-year Treasury note is up at 4.450% at the time of publication.
The yield on the 30-year Treasury note is up at 4.968% at the time of publication.
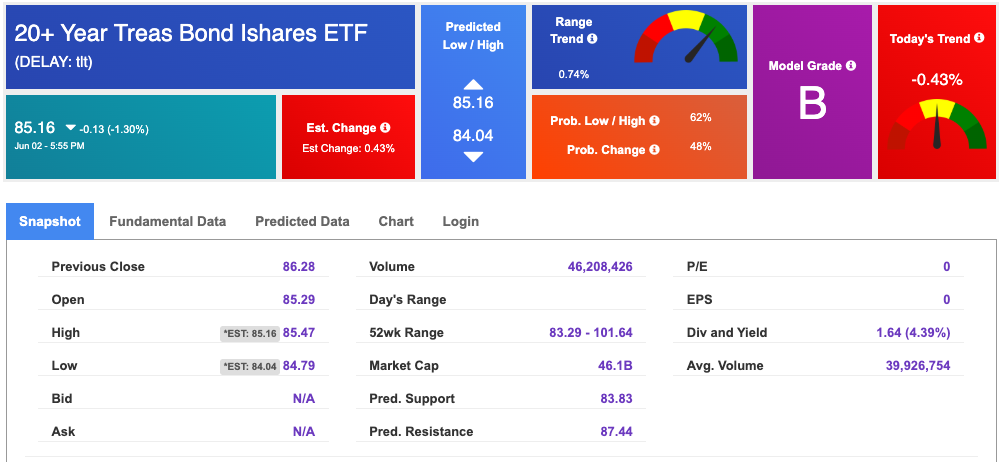
Using the iShares 20+ Year Treasury Bond ETF (TLT) as a proxy for bond prices in our Stock Forecast Tool, we see mixed signals in our 10-day prediction window. Prediction data is uploaded after the market close at 6 p.m., CST. Today’s data is based on market signals from the previous trading session.
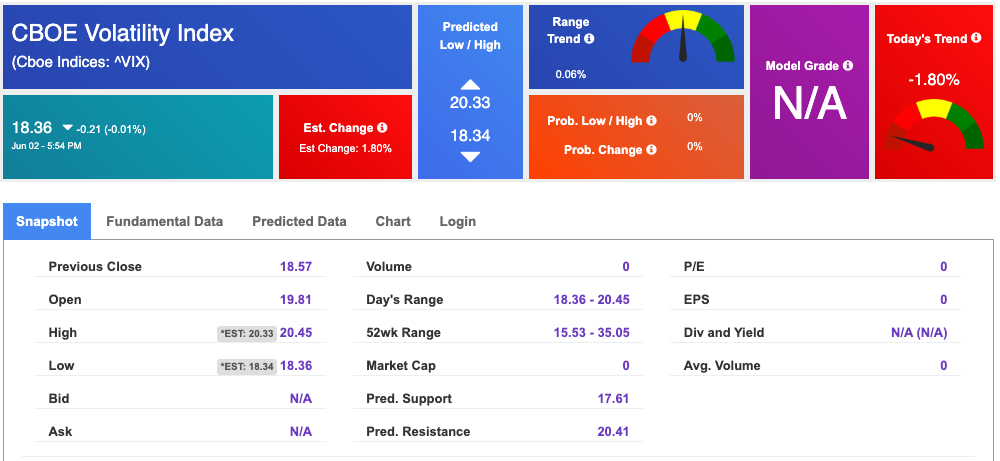
The CBOE Volatility Index (^VIX) is priced at $18.36 at the time of publication, and our 10-day prediction window shows mixed signals. Prediction data is uploaded after the market close at 6 p.m., CST. Today’s data is based on market signals from the previous trading session.
Please share this Tradespoon Market Commentary with your friends.
![]()

![]()
Comments Off on


Tradespoon Tools make finding winning trades in minute as easy as 1-2-3.
Our simple 3 step approach has resulted in an average return of almost 20% per trade!

