 Special Offer: Try the 'Elite Trading Circle Membership' for ONLY $37!
CLICK HERE TO LEARN MORE
Special Offer: Try the 'Elite Trading Circle Membership' for ONLY $37!
CLICK HERE TO LEARN MORE
Markets are hovering just shy of record highs, but the tape is still trading like a range market. The S&P 500 (SPY) continues to respect familiar guardrails, buyers step in near 600–620, and sellers show up into 640–650. Momentum from strong corporate results and AI-driven leaders is real, yet hesitation lingers as investors weigh inflation, tariffs, and what comes next from the Federal Reserve. Volatility cooled after recent data and remains contained, while the 10-year Treasury has oscillated around the low-4s, keeping rate-sensitive areas honest and reminding everyone that higher-for-longer is still a possibility.
Last week’s chronology explains the push and pull. Tuesday’s CPI offered a brief exhale: headline inflation eased to 2.7% year over year, core held near 3.1%, yields slipped, and the VIX fell to a yearly low near the mid-teens. Traders even flirted with the idea of a bigger September rate cut. That optimism didn’t survive Thursday. A hot PPI print—up 0.9% month over month—repriced expectations back toward a quarter-point move and refocused attention on goods-price pressure. At the same time, tariff headlines crept back in. Higher levies on select categories, including some semiconductor goods, revived supply-chain and margin worries just as growth signals were cooling. The index-level impact was a wobble rather than a break, helped by a late-week dose of stock-specific strength: a large new stake in a major health-care bellwether sparked a double-digit jump and powered the Dow to fresh highs. Meanwhile, July retail sales rose 0.5%—slower than June but still a sign the consumer isn’t cracking—helping the 10-year drift back toward roughly 4.28% into Friday’s close.
This week opened quieter. Monday’s session was essentially flat for the S&P 500 and Nasdaq, while the two-year yield hovered near 3.8% and the ten-year edged around 4.34%. The market’s attention is fixed on Jackson Hole, where Chair Jerome Powell’s Friday keynote will set the tone for a September decision that futures markets see as highly likely to deliver a 25-basis-point cut. The wrinkle is guidance: even if the Fed trims in September, the message could lean hawkish on the path ahead, especially if officials frame recent inflation as partly tariff-related and therefore not a clean, sustained downtrend. That’s why the tape is calm on the surface but quick to rotate under the hood—big tech leadership can carry the averages, yet the next macro surprise still has the power to move the whole range at once.
Technically, nothing breaks the story: SPY remains capped into 640–650 and supported near 600–620. Until volume and follow-through confirm a move, range tactics tend to work better than breakout bets. Sentiment is balanced but cautious. Confidence in mega-cap earnings power is keeping indices aloft; at the same time, valuations are stretched enough that an unfriendly headline—on tariffs, a sticky inflation component, or softer activity data—could spark fast de-risking. Recession risk hasn’t vanished: hiring has cooled at the margin, credit conditions remain tighter than a year ago, and trade frictions raise the odds of goods inflation flaring at the wrong moment. The base case, however, is still “slowdown, not slide,” supported by a resilient consumer and corporate balance sheets that can absorb moderate shocks.
The near-term roadmap is straightforward. Housing data will show how sensitive construction remains to mortgage rates. FOMC minutes should clarify how the Committee is balancing a softer growth pulse with the risk that tariffs keep certain prices sticky. Flash PMIs will offer a timely check on whether manufacturing and services are bending or breaking. Then comes Jackson Hole: if Powell signals a cautious, one-and-done approach to September with a keep-rates-restrictive bias, the market can continue grinding within the range; if he opens the door to a slower economy and a more accommodative path beyond September, a decisive test of the 640–650 ceiling becomes more plausible. Conversely, if the messaging underplays disinflation progress or leans heavily on tariff-related price risks, the lower band around 600–620 is likely to be probed again.
In this backdrop, patience and precision matter. We’re respecting the range instead of forcing it, pairing durable growth stories—particularly AI beneficiaries with real earnings power and diversified demand—with steady, income-oriented exposure that can cushion tariff-driven bumps. Position sizes stay right-sized into data and policy events, and risk is defined so we can lean in when the numbers cooperate and tighten up when they don’t. If the next prints corroborate cooling inflation without denting demand, we can add selectively into strength toward 640–650; if goods prices or activity data disappoint, we’ll favor protection and wait for better entry points closer to 600–620.
For readers who want clearer levels, scenario maps, and stock-specific setups that don’t depend on the index breaking out, Tradespoon’s predictive analytics can help separate signal from noise. Our models are built for exactly this kind of market—sideways with bite—highlighting where probability, timing, and discipline meet.
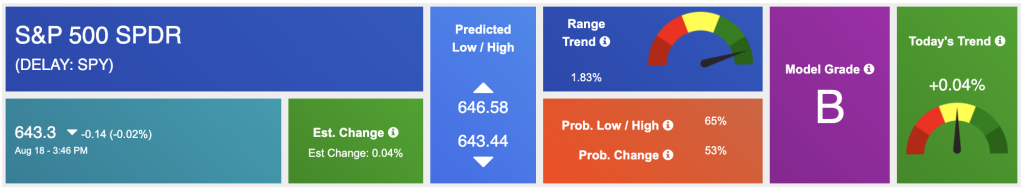
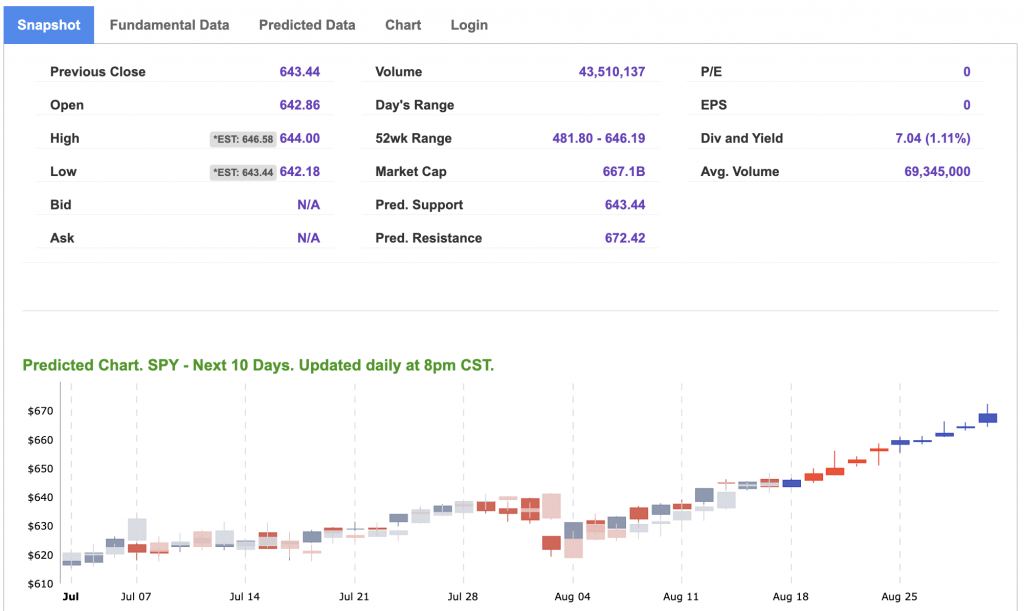
Using the “SPY” symbol to analyze the S&P 500, our 10-day prediction window shows a near-term positive outlook. Prediction data is uploaded after the market closes at 6 p.m. CST. Today’s data is based on market signals from the previous trading session.
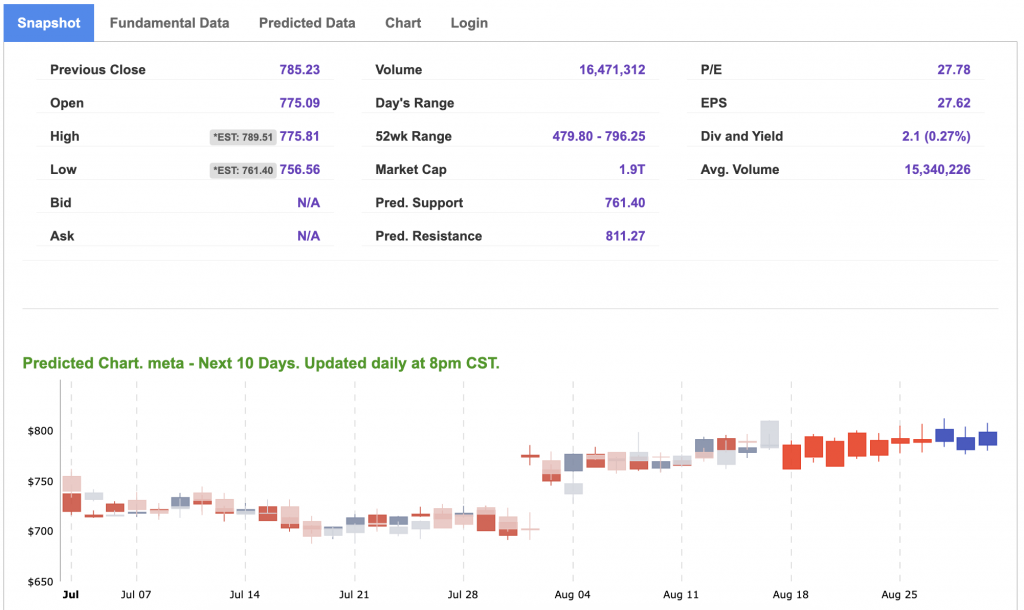
Our featured symbol for Tuesday is META. Meta Platforms Inc. is showing a steady vector in our Stock Forecast Toolbox’s 10-day forecast.
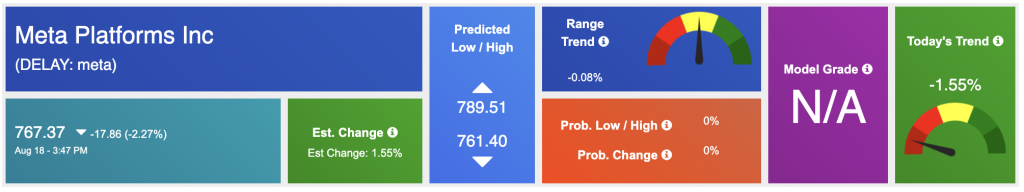
The symbol is trading at $111.94 with a vector of -0.55% at the time of publication.
10-Day Prediction data is uploaded after the market close at 6 p.m., CST. Today’s data is based on market signals from the previous trading session.
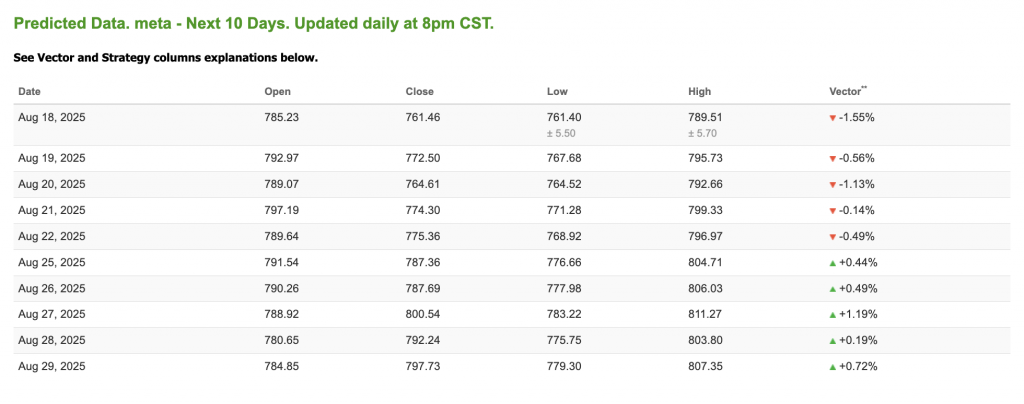
Note: The Vector column calculates the change of the Forecasted Average Price for the next trading session relative to the average of actual prices for the last trading session. The column shows the expected average price movement “Up or Down”, in percent. Trend traders should trade along the predicted direction of the Vector. The higher the value of the Vector the higher its momentum.
*Please note: At the time of publication, Vlad Karpel does have a position in the featured symbol, meta. Our featured symbol is part of your free subscription service. It is not included in any paid Tradespoon subscription service. Vlad Karpel only trades his money in paid subscription services. If you are a paid subscriber, please review your Premium Member Picks, ActiveTrader, or MonthlyTrader recommendations. If you are interested in receiving Vlad’s picks, please click here.
West Texas Intermediate for Crude Oil delivery (CL.1) is priced at $63.36 per barrel, UP 0.89%, at the time of publication.
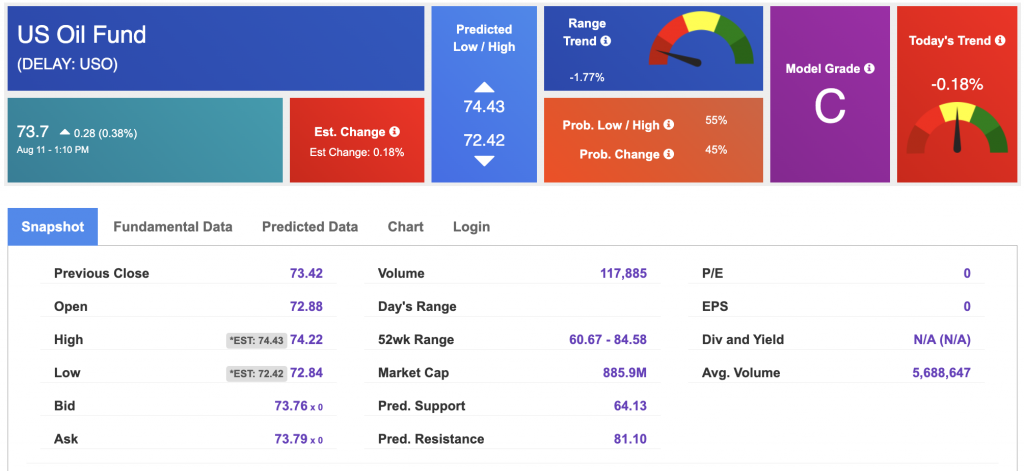
Looking at USO, a crude oil tracker, our 10-day prediction model shows mixed signals. The fund is trading at $73.7 at the time of publication. Prediction data is uploaded after the market close at 6 p.m., CST. Today’s data is based on market signals from the previous trading session.
The price for the Gold Continuous Contract (GC00) is DOWN 0.13% at $3,378.10 at the time of publication.
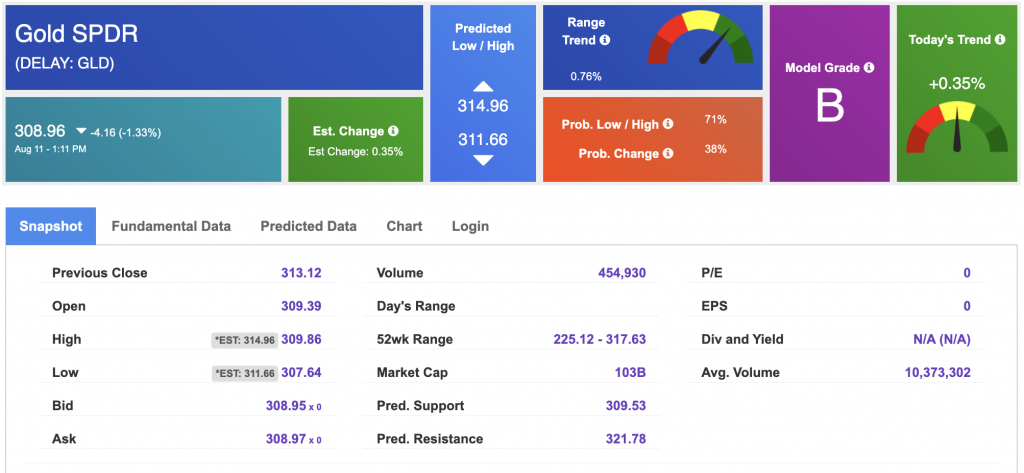
Using SPDR GOLD TRUST (GLD) as a tracker in our Stock Forecast Tool, the 10-day prediction window shows mixed signals. The gold proxy is trading at $308.96 at the time of publication. Vector signals show +0.35% for today. Prediction data is uploaded after the market close at 6 p.m., CST. Today’s data is based on market signals from the previous trading session.
The yield on the 10-year Treasury note is up at 4.340% at the time of publication.
The yield on the 30-year Treasury note is up at 4.936% at the time of publication.
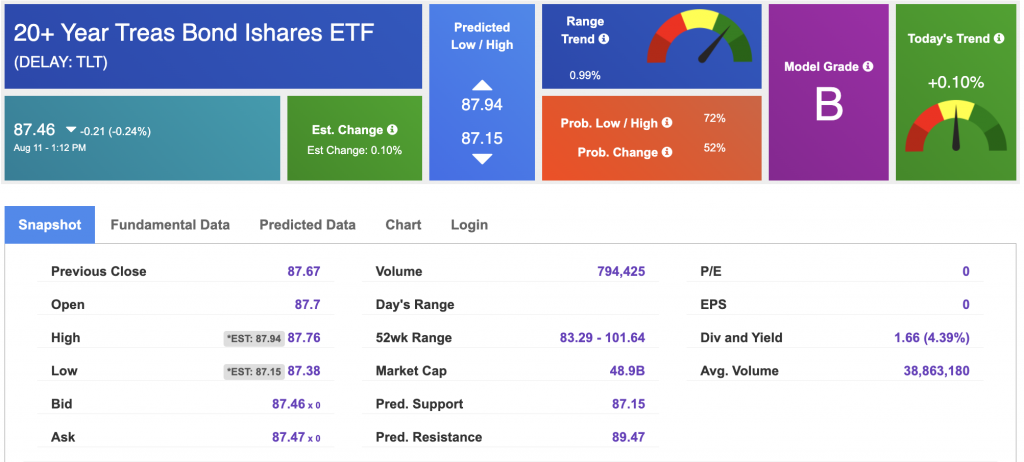
Using the iShares 20+ Year Treasury Bond ETF (TLT) as a proxy for bond prices in our Stock Forecast Tool, we see mixed signals in our 10-day prediction window. Prediction data is uploaded after the market close at 6 p.m., CST. Today’s data is based on market signals from the previous trading session.
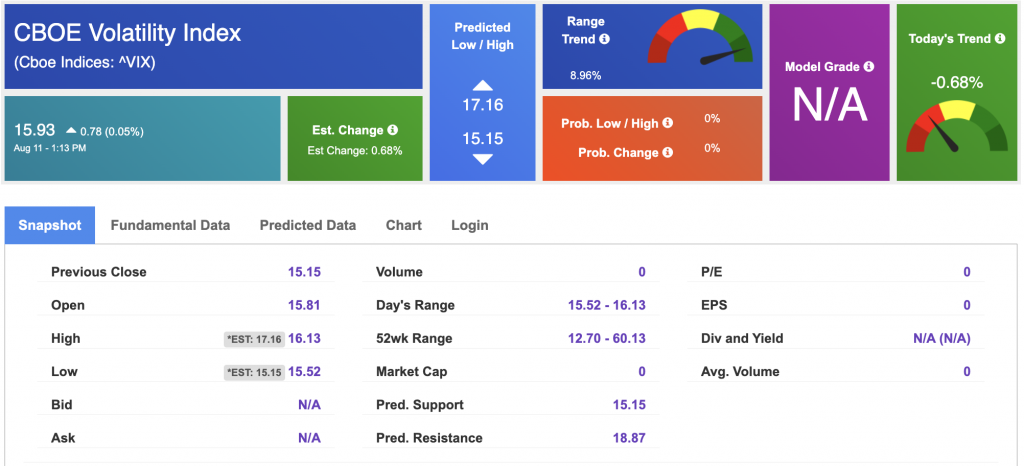
The CBOE Volatility Index (^VIX) is priced at $15.93 at the time of publication, and our 10-day prediction window shows mixed signals. Prediction data is uploaded after the market close at 6 p.m., CST. Today’s data is based on market signals from the previous trading session.
Please share this Tradespoon Market Commentary with your friends.
![]()

![]()
Comments Off on


Tradespoon Tools make finding winning trades in minute as easy as 1-2-3.
Our simple 3 step approach has resulted in an average return of almost 20% per trade!