 Special Offer: Get a 'Standalone' WeeklyTrader Membership for much less than the cost of the entire Elite Membership!
CLICK HERE TO LEARN MORE
Special Offer: Get a 'Standalone' WeeklyTrader Membership for much less than the cost of the entire Elite Membership!
CLICK HERE TO LEARN MORE
A tighter tape heads into mega-cap earnings and Friday’s CPI with 10-year near 4% and volatility cooling.
Markets kick off the week with the same tug-of-war: noisy policy headlines and a temporary data blackout on one side, solid earnings power—especially from banks and the AI supply chain—on the other. Stocks have held up without help from falling yields, with mega-cap tech and chipmakers absorbing shocks while gold stays bid as a policy hedge. In place of missing reports, big-bank updates filled the gap and pointed to a sturdier consumer than feared: cleaner delinquencies, leaner loss reserves, and steady spending.
Tariff talk has spiked and cooled, briefly reviving supply-chain worries before fading. Through it all, the AI investment cycle kept humming—more foundry capacity, hyperscaler commitments, and upbeat reads from Taiwan Semi suggest demand is being pulled forward. Rates remain the metronome: a 10-year near 4% lets multiples breathe and growth lead; a push higher tends to rotate leadership toward value and defensives. Volatility is higher than summer’s lull, but it’s a risk to manage, not a thesis breaker.
Circling back to how last week ended helps explain why the bid reappeared. Thursday saw risk appetite wobble as regional-bank loan headlines clipped cyclicals, the 10-year slipped back through the psychologically heavy 4% line, and gold pressed to fresh highs while oil extended a multi-session decline on inventory builds and softer refinery runs. Indexes tested their 50-day moving averages as the VIX pushed into the mid-20s, a level that prices roughly 1.5%–1.6% daily S&P swings and demands tighter risk management.
Friday traded with a different texture: a drift that firmed into the close as prospects for renewed U.S.–China engagement later this month helped stabilize tone. The Dow rose about 0.7%, the S&P 500 and Nasdaq added roughly 0.6%, and rates bounced modestly off Thursday’s lows with the two-year near 3.47% and the ten-year edging back toward ~4.01%. Under the surface, leadership rotated.
A few AI and momentum winners cooled while value, quality, low-volatility, and dividend cohorts did the heavy lifting; sector performance echoed that rotation, with staples, financials, discretionary, and energy outpacing materials, utilities, health care, and real estate. The message into the weekend was clear: the thesis hadn’t broken—the runway had simply narrowed.
Today’s tape picked up that hand-off and pressed it forward. By Monday afternoon, the S&P 500 was up about 1.1% and within a couple tenths of its October 8 record; the Nasdaq gained roughly 1.5% and was similarly near its high, while the Dow added around 520 points (~1.1%) and flirted with its 12th record close of the year. Futures had telegraphed the tone as trade-tension rhetoric cooled and regional-bank concerns faded to background noise.
Yields stayed supportive—the two-year around 3.47% and the ten-year a hair below 4%—and implied volatility backed off last week’s spike, with the VIX sliding back under 20 as the session wore on. Single-name catalysts helped: Apple rallied on an upgrade and a sizable target boost tied to record iPhone shipment expectations; Nvidia inched higher as headlines spotlighted the first U.S.-made Blackwell wafer rolling off a TSMC line in Phoenix, an incremental proof point for domestic capacity and evidence that the AI cycle remains intact. Precious metals stayed firm with gold near last week’s peak—ongoing policy insurance rather than a signal of imminent stress.
The near-term calendar keeps the market’s focus tight. This week’s marquee earnings (Netflix, Tesla, Intel among them) offer fresh reads on demand elasticity, margin discipline, and where AI is translating from capex to operating leverage. On the macro side, the shutdown-delayed September CPI is slated for Friday, October 24, and will reset the conversation around policy timing. The rate path will keep dictating factor leadership: an orderly 10-year near or below 4% is friendly to multiples and growth leadership; a decisive push higher would re-energize rotation into value and defensives.
Our roadmap sharpens rather than changes. If bank commentary continues to “hold serve” and the next marquee AI print validates demand, SPY can grind toward 680–700 on the next push, with 620–640 acting as buy-the-dip support on orderly retracements. The risks are straightforward and worth respecting: a stickier high-volatility regime that triggers mechanical de-risking, a decisive re-break higher in long rates that compresses multiples, or a data catch-up that reveals an unwelcome inflection in the labor market once reports normalize. None are foregone conclusions, but any one could narrow the runway.
Positioning follows the tape we have, not the one we wish for. Keep leaning on the market’s profit centers—AI horsepower and high-quality balance sheets—while staying opportunistic in disciplined cyclicals when credit holds. Executing with entries on confirmation, staggering profit-taking, and trailing risk rather than anchoring to static targets remains the right playbook in a regime where timing beats conviction. If semis and banks keep the floor intact and Friday’s CPI cooperates, the path of least resistance is still a choppy grind higher—AI leading on the upswings, rotation doing the heavy lifting when the market pauses to catch its breath.
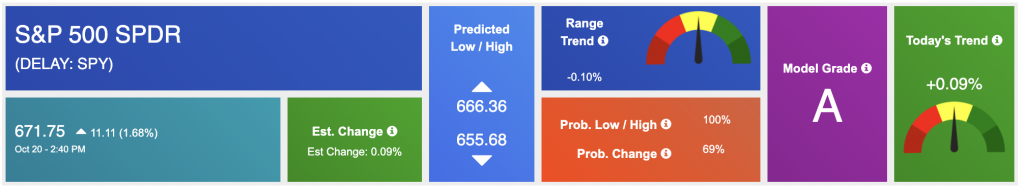
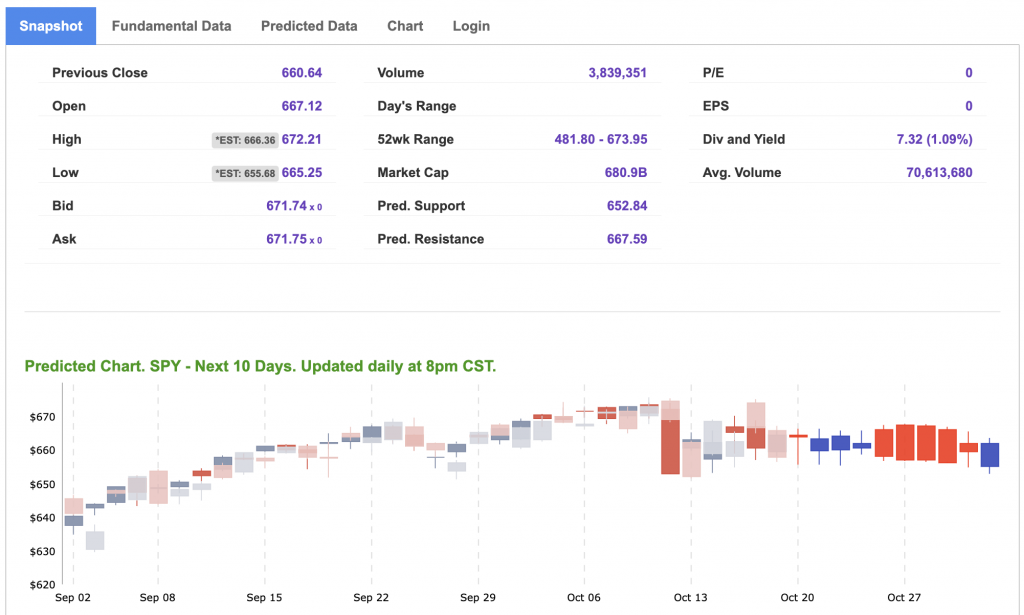
Using the “SPY” symbol to analyze the S&P 500, our 10-day prediction window shows a near-term positive outlook. Prediction data is uploaded after the market closes at 6 p.m. CST. Today’s data is based on market signals from the previous trading session.
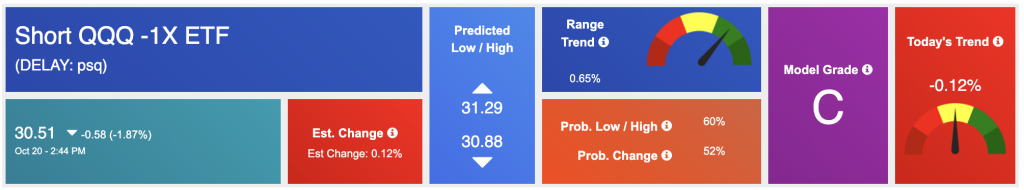
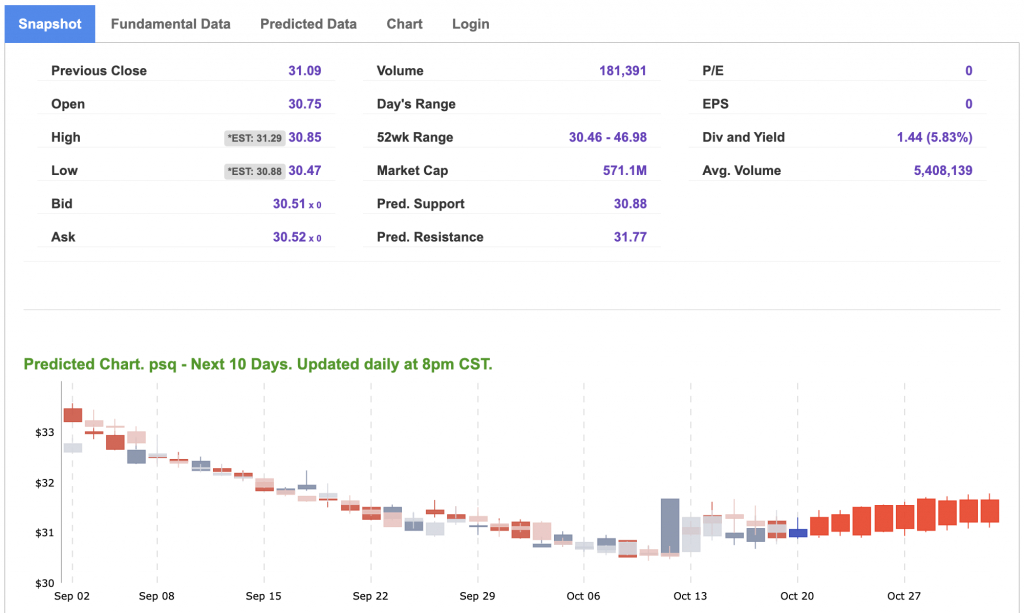
Our featured symbol for Tuesday is PSQ. Short QQQ -1X ETF is showing a steady vector in our Stock Forecast Toolbox’s 10-day forecast.
The symbol is trading at $30.51 with a vector of -0.12% at the time of publication.
10-Day Prediction data is uploaded after the market close at 6 p.m., CST. Today’s data is based on market signals from the previous trading session.
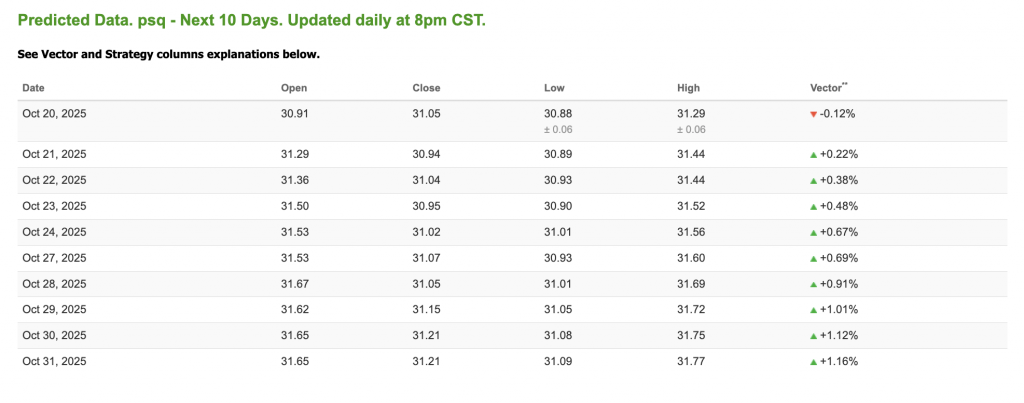
Note: The Vector column calculates the change of the Forecasted Average Price for the next trading session relative to the average of actual prices for the last trading session. The column shows the expected average price movement “Up or Down”, in percent. Trend traders should trade along the predicted direction of the Vector. The higher the value of the Vector the higher its momentum.
*Please note: At the time of publication, Vlad Karpel does have a position in the featured symbol, PSW. Our featured symbol is part of your free subscription service. It is not included in any paid Tradespoon subscription service. Vlad Karpel only trades his money in paid subscription services. If you are a paid subscriber, please review your Premium Member Picks, ActiveTrader, or MonthlyTrader recommendations. If you are interested in receiving Vlad’s picks, please click here.
West Texas Intermediate for Crude Oil delivery (CL.1) is priced at $57.50 per barrel, down 0.07%, at the time of publication.
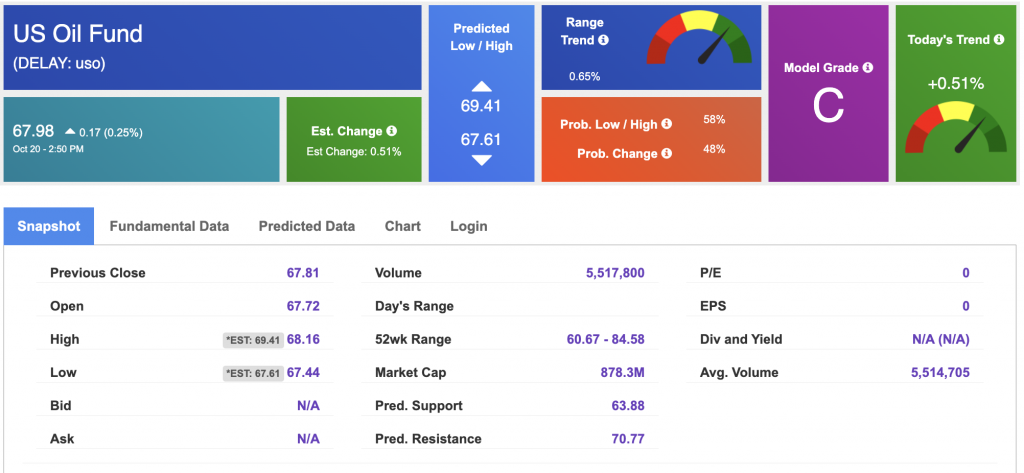
Looking at USO, a crude oil tracker, our 10-day prediction model shows mixed signals. The fund is trading at $67.98 at the time of publication. Prediction data is uploaded after the market close at 6 p.m., CST. Today’s data is based on market signals from the previous trading session.
The price for the Gold Continuous Contract (GC00) is up 4.17% at $4,388.50 at the time of publication.
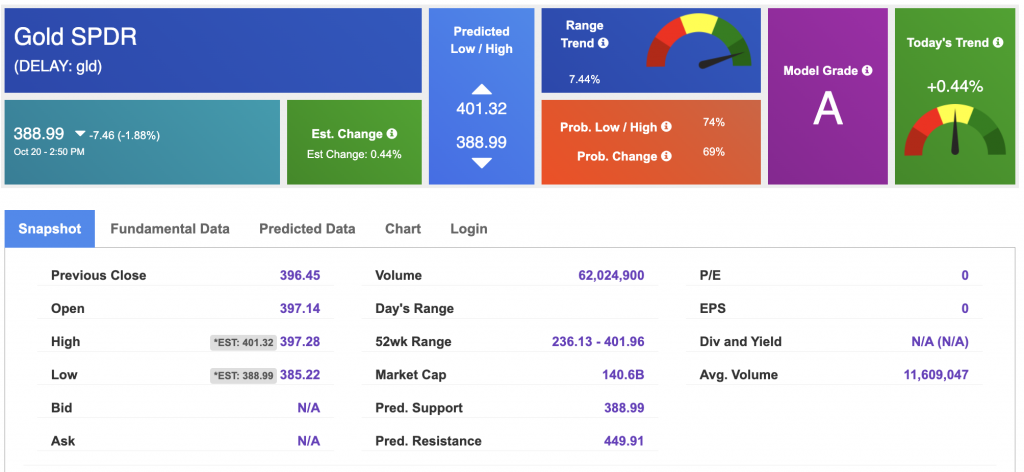
Using SPDR GOLD TRUST (GLD) as a tracker in our Stock Forecast Tool, the 10-day prediction window shows mixed signals. The gold proxy is trading at $388.99 at the time of publication. Vector signals show +0.44% for today. Prediction data is uploaded after the market close at 6 p.m., CST. Today’s data is based on market signals from the previous trading session.
The yield on the 10-year Treasury note is down at 3.984% at the time of publication.
The yield on the 30-year Treasury note is down at 4.573% at the time of publication.
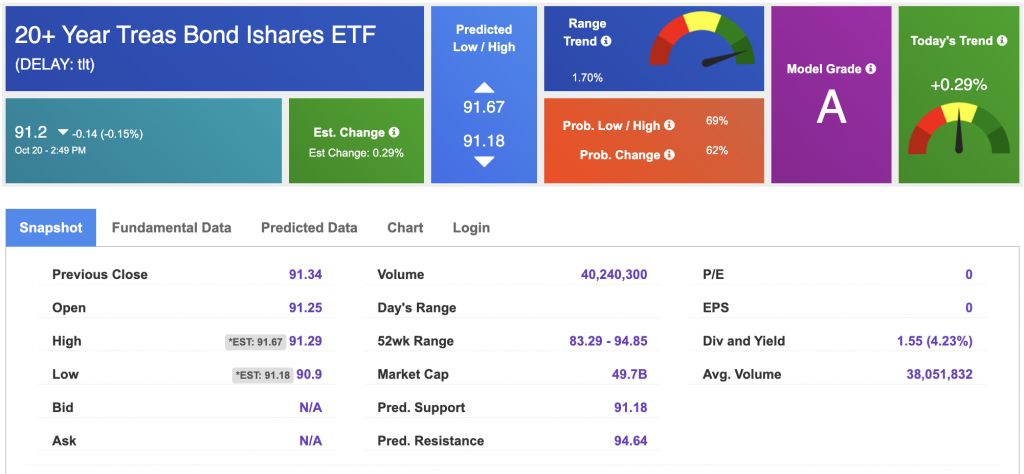
Using the iShares 20+ Year Treasury Bond ETF (TLT) as a proxy for bond prices in our Stock Forecast Tool, we see mixed signals in our 10-day prediction window. Prediction data is uploaded after the market close at 6 p.m., CST. Today’s data is based on market signals from the previous trading session.
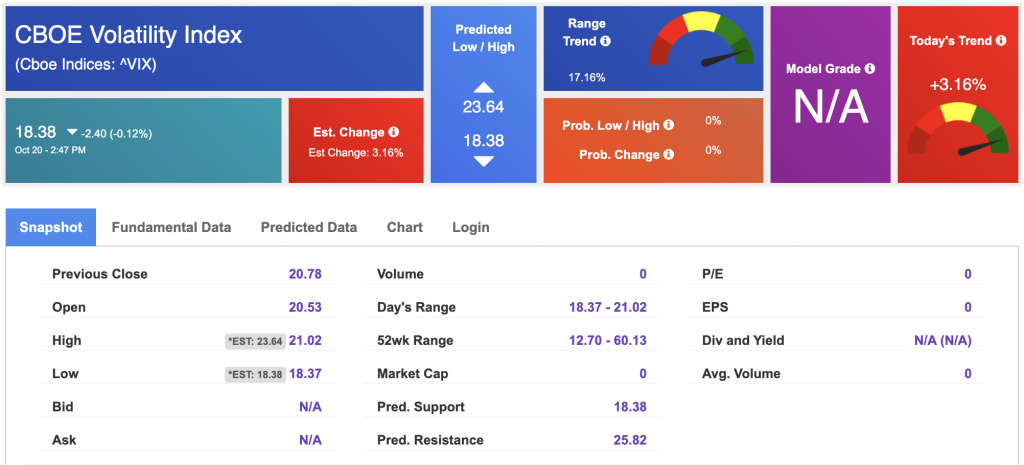
The CBOE Volatility Index (^VIX) is priced at $18.38 at the time of publication, and our 10-day prediction window shows mixed signals. Prediction data is uploaded after the market close at 6 p.m., CST. Today’s data is based on market signals from the previous trading session.
Please share this Tradespoon Market Commentary with your friends.
![]()

![]()
Comments Off on


Tradespoon Tools make finding winning trades in minute as easy as 1-2-3.
Our simple 3 step approach has resulted in an average return of almost 20% per trade!