 Special Offer: Try the 'Elite Trading Circle Membership' for ONLY $37!
CLICK HERE TO LEARN MORE
Special Offer: Try the 'Elite Trading Circle Membership' for ONLY $37!
CLICK HERE TO LEARN MORE
Stocks are bouncing, but the bigger picture remains far less convincing. Beneath the surface, weakening growth, stubborn inflation risk, selective leadership, and a less flexible Fed are creating a market that looks stable one moment and vulnerable the next.
Markets came into the week already on shaky ground, and the tone deteriorated quickly as geopolitical risk reclaimed center stage. The biggest driver was the intensifying conflict involving Iran and the disruption around the Strait of Hormuz, a passage that remains critical to global energy flows. That shock pushed oil sharply higher, with Brent briefly surging above $119 earlier in the week before pulling back toward the low-$100 area by Monday as traders responded to signs that some shipping could resume and emergency supply measures were being discussed. Even after that retreat, crude remains dramatically elevated on the month, and that is enough to keep inflation anxiety firmly embedded in the market.
The equity market has reflected that stress. Stocks were choppy and fragile for much of the week as investors tried to balance three competing realities: rising energy risk, softer economic momentum, and the possibility that the Federal Reserve may have less flexibility than many had hoped. Reuters reported that the S&P 500 had already slipped below its 100-day moving average earlier this month, a sign that this is no longer a clean, momentum-driven advance. Monday’s bounce has been helpful, but it looks more like a relief rally sparked by easing oil prices and strength in technology than a decisive restoration of confidence.
Under the surface, leadership has narrowed. Technology has continued to provide selective support, and Oracle’s post-earnings surge stood out as one of the clearest reminders that AI-related spending remains a powerful theme. Oracle jumped about 12% after giving an upbeat revenue outlook tied to AI infrastructure demand, reinforcing that the market is still willing to reward companies with visible growth and direct exposure to the data-center buildout. But that kind of company-specific strength is standing out precisely because the broader tape has become much less forgiving.
The oil story has done more than lift the energy complex. It has effectively revived inflation fears all by itself. Even though recent inflation data did not deliver a fresh upside shock, the market is increasingly worried that higher energy costs will filter into the economy and slow the path back toward stable disinflation. That concern is now colliding with a weaker growth backdrop, which is what makes this environment more dangerous than a simple commodity spike. Reuters reported that U.S. fourth-quarter GDP growth was revised down to just 0.7% annualized from a prior 1.4%, a sharp deceleration that suggests the economy was already losing momentum before the latest oil shock hit.
That combination is what has brought stagflation risk back into the conversation. Slower growth on its own would usually strengthen the case for easier policy. Higher oil and renewed inflation pressure on their own would argue for caution. Put them together, and the Fed’s room to pivot becomes much tighter. Markets this week have been forced to reckon with exactly that tension, which is why every rally attempt has felt hesitant and headline-dependent instead of broad and durable. Reuters noted Monday that investors are now pricing in only limited U.S. rate cuts as central banks head into a crowded week of policy meetings.
There were moments when markets tried to lean into de-escalation. Earlier in the week, optimism that the conflict might cool helped knock oil off its highs and briefly steadied equities. But that optimism did not hold because the underlying uncertainty never really left. Oil shipping disruptions, attacks on infrastructure, and mixed political signals kept investors from embracing a lasting risk-on move. Even now, while oil has pulled back from its peak, Reuters reports the broader conflict continues to threaten supply and the U.S. is already leaning heavily on emergency tools to absorb the shock.
Today’s rebound has to be understood in that context. U.S. stocks are indeed rising as oil prices ease, and the move is being helped by technology shares. But this is not the same thing as a clean macro reset. The market is stabilizing because one pressure point has softened temporarily, not because the larger list of risks has disappeared.
Sentiment has clearly shifted from confident to cautious. This is no longer a market behaving as though it is in a routine bullish pause. It is a market reacting in real time to oil headlines, shifting rate expectations, and concern that economic momentum is fading faster than expected. The recent rise in volatility and the market’s inability to hold relief rallies cleanly both point to a tape where buyers are still present, but no longer fully in control. Reuters’ reporting earlier this month tied the selloff directly to soaring oil, job losses, and renewed inflation worries, which fits the uneasy character of trading we have seen.
The rotation beneath the surface also tells an important story. High-duration growth no longer has the same easy authority it enjoyed in a cleaner falling-rate environment. Select AI winners can still work, but broad exposure is no longer enough. Investors are becoming far more selective, favoring visible earnings power, resilient balance sheets, and companies with either pricing power or direct thematic catalysts. That is why names tied to AI infrastructure are still attracting interest even while the broader growth trade has become more uneven.
At the same time, the labor and growth backdrop remains mixed enough to keep recession concerns alive. The GDP downgrade matters, and Reuters also noted earlier this month that job losses and slower activity were already rattling investors before the latest oil escalation fully took hold. That leaves sentiment trapped between two fears: inflation staying sticky and growth slowing too much. Neither one is fatal alone. Together, they create exactly the kind of market that produces sharp rotations, failed breakouts, and narrow leadership.
I remain in the market-neutral camp. The longer-term structure has not fully broken, and I do not think this is the kind of environment where investors should assume the entire bull trend is over. But momentum has cooled meaningfully, and the burden of proof is no longer on the bears alone. The market now needs lower oil, calmer yields, and more confidence that inflation is not about to be reflamed by geopolitics before it can regain a healthier rhythm. Today’s rebound is encouraging, but it does not yet resolve the bigger issue.
My broader view is still that SPY can work its way toward the 700 to 720 area over time if inflation settles, yields calm down, and the geopolitical premium fades. But that bigger upside path matters less in the near term than whether support in the 620 to 650 zone can hold over the next few months. If that area remains intact, the broader uptrend stays structurally alive. If it starts to fail under the combined weight of sticky inflation, elevated energy costs, and softer growth, then the market likely remains volatile, rotational, and much more selective than many investors are used to.
That is the real takeaway from this week. This is no longer a liquidity-driven tape where broad exposure solves everything. It is a market that is demanding quality, durability, and discipline. Investors can still find opportunity here, especially in areas with real earnings support and clear secular demand, but the environment is asking for process over impulse. In a week like this, skill matters more than optimism. The market still wants to stabilize, but until oil, growth, and rate expectations stop fighting each other, caution deserves a seat at the table.
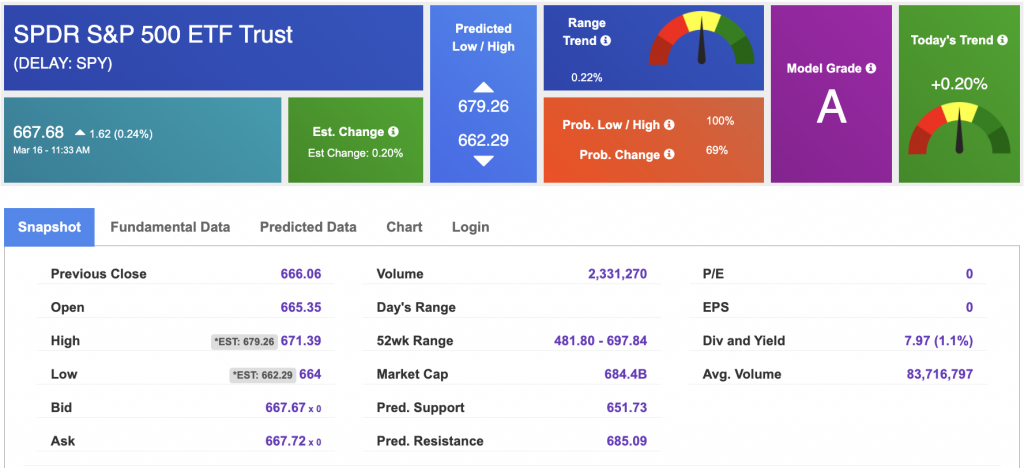
Using the “SPY” symbol to analyze the S&P 500, our 10-day prediction window shows a near-term positive outlook. Prediction data is uploaded after the market closes at 6 p.m. CST. Today’s data is based on market signals from the previous trading session.
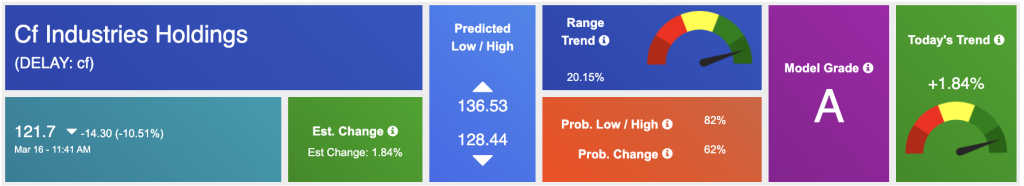
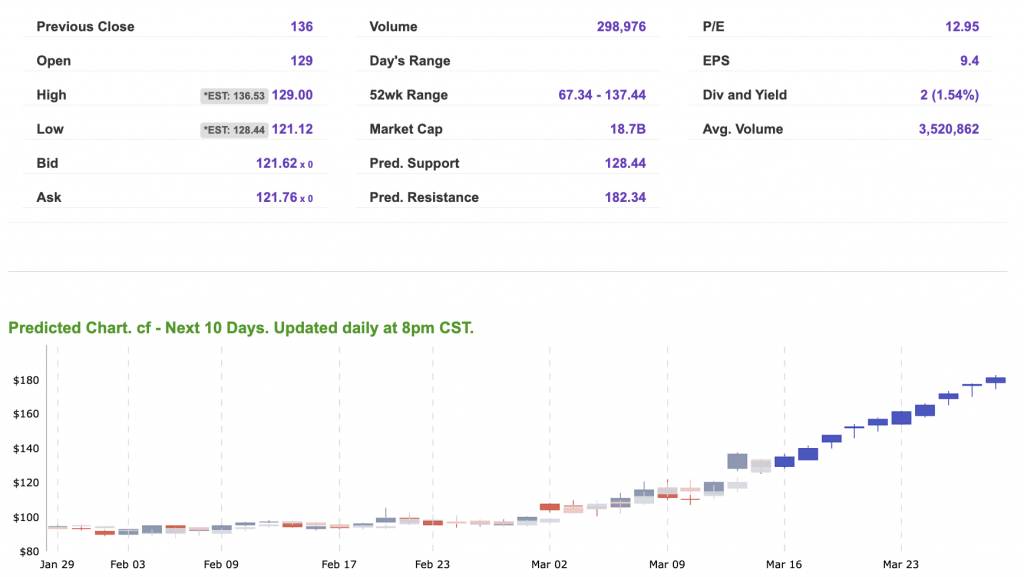
Our featured symbol for Tuesday is CF. CF Industries (CF) is showing a steady vector in our Stock Forecast Toolbox’s 10-day forecast.
The symbol is trading at $121.7 with a vector of +1.82% at the time of publication.
10-Day Prediction data is uploaded after the market close at 6 p.m., CST. Today’s data is based on market signals from the previous trading session.
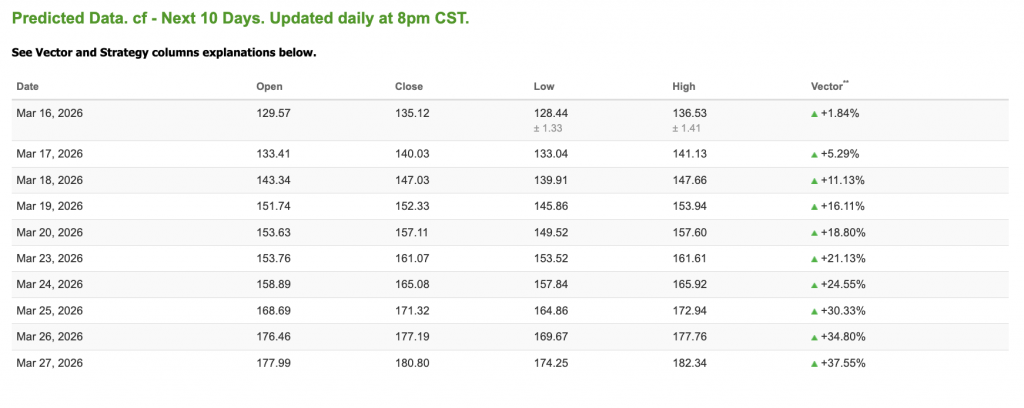
Note: The Vector column calculates the change of the Forecasted Average Price for the next trading session relative to the average of actual prices for the last trading session. The column shows the expected average price movement “Up or Down”, in percent. Trend traders should trade along the predicted direction of the Vector. The higher the value of the Vector the higher its momentum.
*Please note: At the time of publication, Vlad Karpel does have a position in the featured symbol, CF. Our featured symbol is part of your free subscription service. It is not included in any paid Tradespoon subscription service. Vlad Karpel only trades his money in paid subscription services. If you are a paid subscriber, please review your Premium Member Picks, ActiveTrader, or MonthlyTrader recommendations. If you are interested in receiving Vlad’s picks, please click here.
West Texas Intermediate for Crude Oil delivery (CL.1) is priced at 95.58 per barrel, down 3.17%, at the time of publication.
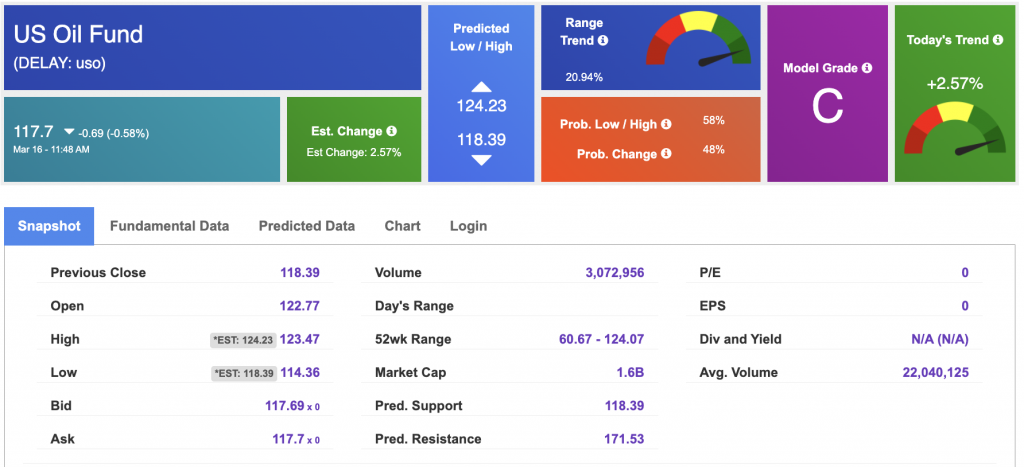
Looking at USO, a crude oil tracker, our 10-day prediction model shows mixed signals. The fund is trading at $117.7 at the time of publication. Prediction data is uploaded after the market close at 6 p.m., CST. Today’s data is based on market signals from the previous trading session.
The price for the Gold Continuous Contract (GC00) is down 1.36% at $4,993.10 at the time of publication.
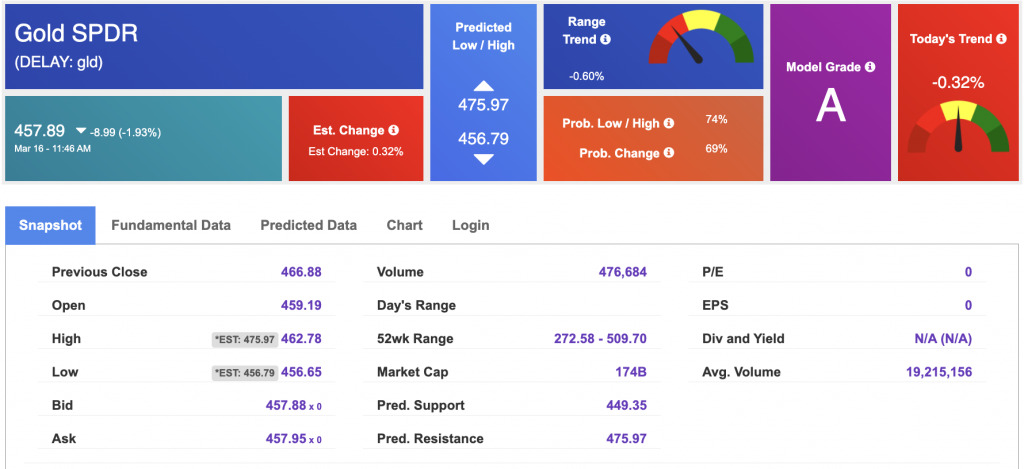
Using SPDR GOLD TRUST (GLD) as a tracker in our Stock Forecast Tool, the 10-day prediction window shows mixed signals. The gold proxy is trading at $457.89 at the time of publication. Vector signals show -0.32% for today. Prediction data is uploaded after the market close at 6 p.m., CST. Today’s data is based on market signals from the previous trading session.
The yield on the 10-year Treasury note is down at 4.246% at the time of publication.
The yield on the 30-year Treasury note is down at 4.881% at the time of publication.
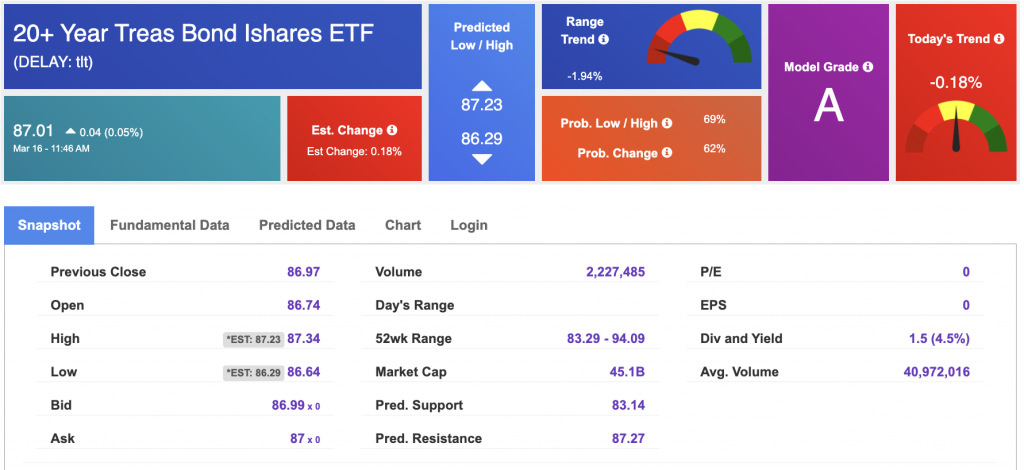
Using the iShares 20+ Year Treasury Bond ETF (TLT) as a proxy for bond prices in our Stock Forecast Tool, we see mixed signals in our 10-day prediction window. Prediction data is uploaded after the market close at 6 p.m., CST. Today’s data is based on market signals from the previous trading session.
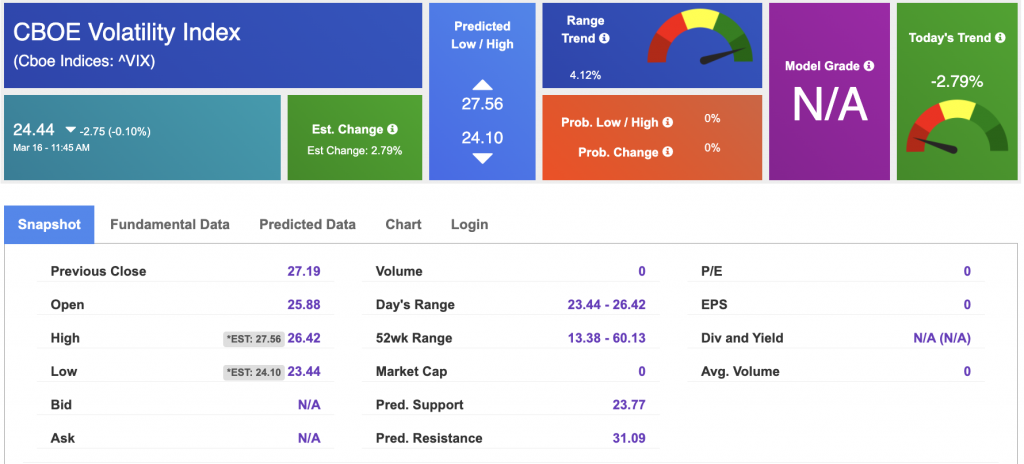
The CBOE Volatility Index (^VIX) is priced at $24.4 at the time of publication, and our 10-day prediction window shows mixed signals. Prediction data is uploaded after the market close at 6 p.m., CST. Today’s data is based on market signals from the previous trading session.
Please share this Tradespoon Market Commentary with your friends.
![]()

![]()
Comments Off on


Tradespoon Tools make finding winning trades in minute as easy as 1-2-3.
Our simple 3 step approach has resulted in an average return of almost 20% per trade!

