 Special Offer: Try the 'ShadowTrader Membership' for ONLY $37!
CLICK HERE TO LEARN MORE
Special Offer: Try the 'ShadowTrader Membership' for ONLY $37!
CLICK HERE TO LEARN MORE
The market entered this week with a familiar setup: prices near record territory, volatility still unusually calm, and a rally that feels strong on the surface but demanding underneath. After the powerful late-week rebound driven by softer inflation data, the S&P 500 extended that move into a third straight up session on Monday, pushing back toward its highest close on record. All three major U.S. indices traded higher, and participation was broad—nearly everything joined the advance, except for consumer staples, which lagged while most cyclical and “risk-on” areas led.
Sector leadership told the real story. Industrials pushed close to 1%, while consumer discretionary rose about 0.8%. The true leaders were energy, financials, and materials, each up roughly 1.2%. Communication services and technology were positive but more measured, while utilities were barely higher and staples were the lone decliner. That mix matters: it suggests the market wasn’t simply chasing a narrow tech bounce—it was rotating back toward growth-and-cycle exposure at the same time, which is often what you want to see when a rebound is trying to mature into something more durable. Small-caps, momentum, and higher-beta strategies also participated, reinforcing the idea that risk appetite is rebuilding, at least for now.
The core driver remains the same catalyst chain that ignited last Thursday: inflation relief plus renewed confidence in the AI demand story. The cooler CPI read helped ease the immediate pressure on valuations, while strong AI-linked earnings—Micron being the key spark—helped stabilize the narrative that spending on AI infrastructure is still real and still moving through the supply chain. That combination gave markets “permission” to re-risk after the earlier wave of selling in AI-adjacent names.
But the market’s other anchor—rates—reminded everyone it’s not going away. On Monday, yields firmed: the 2-year moved up to roughly 3.51%, and the 10-year rose toward 4.17%. The 10-year, in particular, remains the market’s thermostat, and it’s still swinging inside a wide band that has effectively defined this entire regime. That range—roughly 3.6% to 4.2%—is the difference between growth stocks feeling expensive-but-justified versus expensive-and-fragile, and it’s why leadership can flip quickly from tech/momentum to defensives/value and back again.
Now, we shift from last week’s inflation narrative into this week’s data gauntlet—compressed by the holiday schedule. Markets will close early on 12/24 and remain closed on 12/25, which can amplify moves as liquidity thins. Tuesday (12/23) is packed: the BEA’s initial estimate of third-quarter GDP (consensus around 3.2%, down from 3.8% in Q2), durable goods (headline expected to fall about 1.5% month over month, with ex-transportation expected to rise modestly), and the Conference Board’s Consumer Confidence (expected around 91.7, a bounce from a notably weak November reading). This lineup matters because it will either validate the “cooling but controlled” narrative—or reintroduce recession fear and rate volatility in a hurry.
Investor mood has improved, but it’s still conditional. Last week’s rebound was real, but it was also very “macro-permissioned”: inflation came in cooler than expected, yields eased initially, and risk assets responded immediately. Monday’s broad participation is encouraging, especially with cyclicals and small-caps joining the move, but the tape continues to trade like it’s balancing on two rails. On one rail, the market wants to believe inflation is cooling and the Fed will have more flexibility as we move into 2026. On the other hand, tariffs and slowing macro data keep the floor shaky—because they raise uncertainty around margins, supply chains, and whether disinflation can stay clean.
That’s why this remains a sensitive market even near the highs. Under the surface, economic cooling hasn’t disappeared—unemployment has been ticking up, and growth looks slower—so the market’s risk appetite is less about “all-clear” and more about “not yet broken.” Add the persistent debate about how much AI upside is already priced in, and you get a market that can rally, but will demand constant confirmation from data and yields to keep extending.
I’m still in the market-neutral camp. Momentum has deteriorated enough that I respect the “higher for longer” risk—especially if yields re-accelerate and unemployment continues to creep higher. At the same time, the market’s ability to stay near record highs with volatility subdued tells you dip-buying capital is still active, particularly when inflation cooperates, and AI demand signals remain intact. In other words, the bull case is alive—but it’s no longer carefree.
From a roadmap perspective, I still see a path for SPY to work toward the 680–700 zone if inflation continues to cool in a controlled way and rates stay contained. But the near-term level that matters most remains the 620–640 support band over the next few months. If that zone holds, pullbacks are more likely to resolve as rotations rather than breakdowns. If it fails—especially alongside a renewed spike in the 10-year yield toward the top of its range—expect sharper leadership changes, more violent day-to-day swings, and a market that stops rewarding “hope” and starts demanding “proof.”
This week’s action item is simple: let the data set the tone, not the headlines. Watch GDP and durable goods for growth durability, consumer confidence for demand psychology, and the 10-year yield for whether the market’s valuation thermostat is cooling or overheating. If yields stabilize and the data supports a soft-landing path, there’s room for the rally to broaden. If yields spike or the data deteriorates, the same market that looks strong today can rotate hard tomorrow.
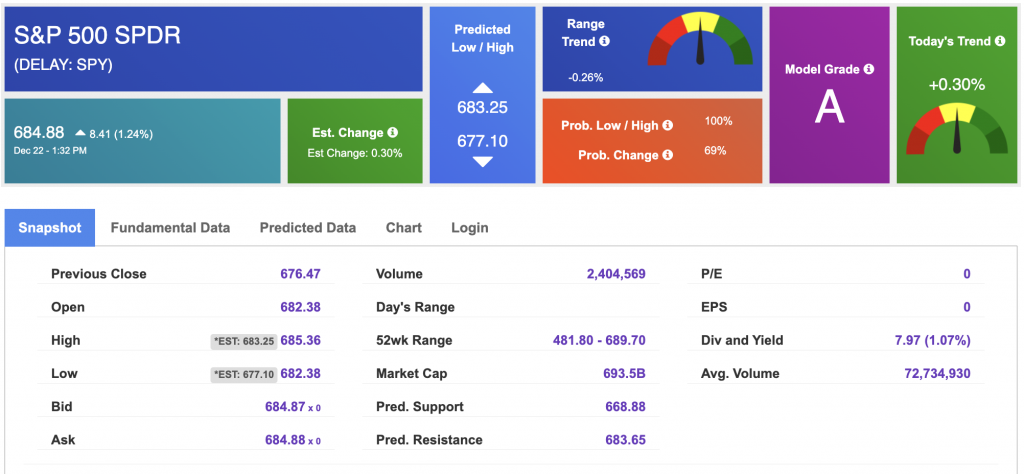
Using the “SPY” symbol to analyze the S&P 500, our 10-day prediction window shows a near-term positive outlook. Prediction data is uploaded after the market closes at 6 p.m. CST. Today’s data is based on market signals from the previous trading session.
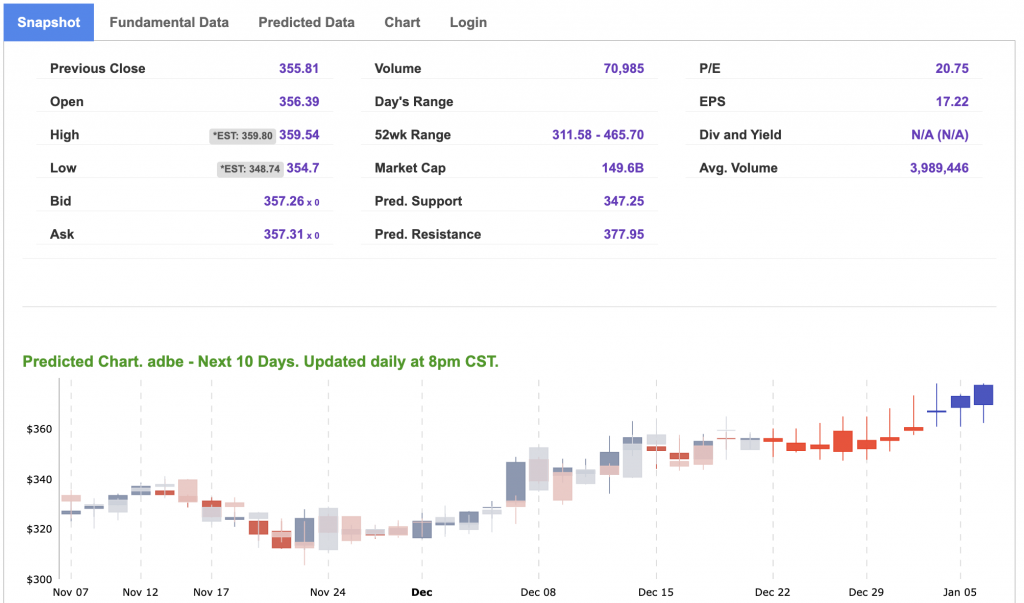
Our featured symbol for Tuesday is ADBE. Adobe Systems Inc. (ADBE) is showing a steady vector in our Stock Forecast Toolbox’s 10-day forecast.
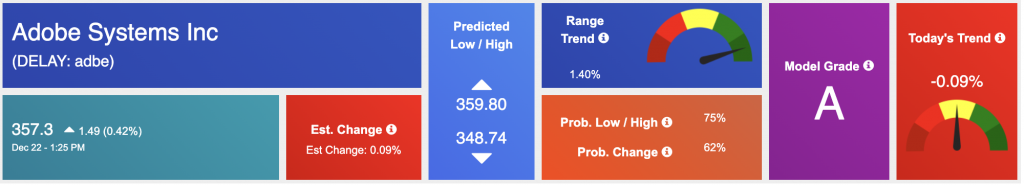
The symbol is trading at $357.3 with a vector of -0.09% at the time of publication.
10-Day Prediction data is uploaded after the market close at 6 p.m., CST. Today’s data is based on market signals from the previous trading session.
Note: The Vector column calculates the change of the Forecasted Average Price for the next trading session relative to the average of actual prices for the last trading session. The column shows the expected average price movement “Up or Down”, in percent. Trend traders should trade along the predicted direction of the Vector. The higher the value of the Vector the higher its momentum.
*Please note: At the time of publication, Vlad Karpel does have a position in the featured symbol, ADBE. Our featured symbol is part of your free subscription service. It is not included in any paid Tradespoon subscription service. Vlad Karpel only trades his money in paid subscription services. If you are a paid subscriber, please review your Premium Member Picks, ActiveTrader, or MonthlyTrader recommendations. If you are interested in receiving Vlad’s picks, please click here.
West Texas Intermediate for Crude Oil delivery (CL.1) is priced at $58.01 per barrel, up 2.64%, at the time of publication.

Looking at USO, a crude oil tracker, our 10-day prediction model shows mixed signals. The fund is trading at $69.77 at the time of publication. Prediction data is uploaded after the market close at 6 p.m., CST. Today’s data is based on market signals from the previous trading session.
The price for the Gold Continuous Contract (GC00) is up 1.86% at $4,469.20 at the time of publication.

Using SPDR GOLD TRUST (GLD) as a tracker in our Stock Forecast Tool, the 10-day prediction window shows mixed signals. The gold proxy is trading at $407.67 at the time of publication. Vector signals show +0.28% for today. Prediction data is uploaded after the market close at 6 p.m., CST. Today’s data is based on market signals from the previous trading session.
The yield on the 10-year Treasury note is up at 4.175% at the time of publication.
The yield on the 30-year Treasury note is up at 4.844% at the time of publication.
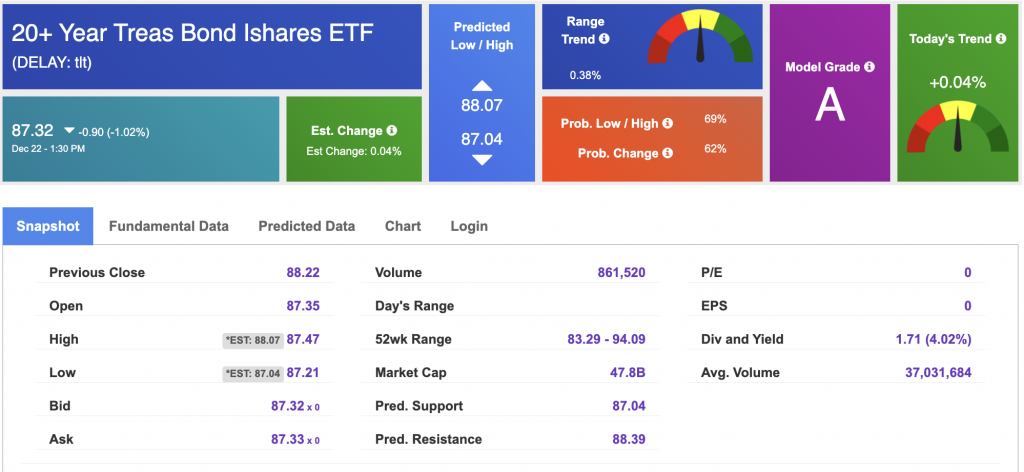
Using the iShares 20+ Year Treasury Bond ETF (TLT) as a proxy for bond prices in our Stock Forecast Tool, we see mixed signals in our 10-day prediction window. Prediction data is uploaded after the market close at 6 p.m., CST. Today’s data is based on market signals from the previous trading session.
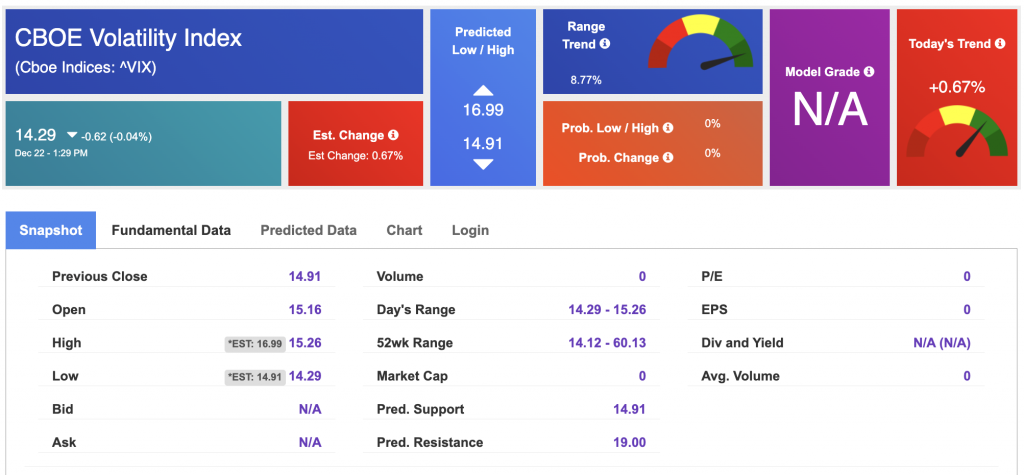
The CBOE Volatility Index (^VIX) is priced at $14.29 at the time of publication, and our 10-day prediction window shows mixed signals. Prediction data is uploaded after the market close at 6 p.m., CST. Today’s data is based on market signals from the previous trading session.
Please share this Tradespoon Market Commentary with your friends.
![]()

![]()
Comments Off on


Tradespoon Tools make finding winning trades in minute as easy as 1-2-3.
Our simple 3 step approach has resulted in an average return of almost 20% per trade!

