 Special Offer: Try the 'ShadowTrader Membership' for ONLY $37!
CLICK HERE TO LEARN MORE
Special Offer: Try the 'ShadowTrader Membership' for ONLY $37!
CLICK HERE TO LEARN MORE
U.S. equities leaned lower again as the market’s leadership problem re-emerged: when technology stumbles, there hasn’t been enough broad participation to keep the major averages steady. By late afternoon Monday, the Dow was modestly down around 0.1%, the S&P 500 slipped roughly 0.2%, and the Nasdaq led to the downside, down more than 0.5% at its worst as selling pressure in megacap and AI-linked names picked up.
What makes this move more instructive than dramatic is the backdrop in rates. Treasury yields were mildly lower as investors continued to anticipate additional Federal Reserve cuts down the road—typically a supportive input for equities and growth expectations. Yet stocks couldn’t translate that “help” into sustained upside. That disconnect is a tell: the market isn’t struggling because liquidity vanished overnight; it’s struggling because positioning is crowded, expectations are high, and leadership is increasingly narrow.
The headline driver was straightforward: profit-taking in technology after a multi-year run, now colliding with a more specific concern—whether the AI buildout is starting to look too expensive relative to the returns it can realistically generate. Software was hit as investors questioned whether data center spending (the backbone of AI infrastructure) is becoming exorbitant. Hardware echoed the same anxiety: Broadcom was notably weak, and chip names more broadly felt the pressure as the market re-priced the risk of any slowdown in data-center capex translating into softer demand for AI-focused chips.
Zooming out to the prior week, the contradiction that’s been defining this market intensified. Index levels stayed close to all-time highs and the VIX hovered around 16, but the underlying tape felt fragile: breadth was weak, most stocks traded lower on key days, and leadership stayed concentrated in a small cohort of technology and AI-linked winners. Factor performance reinforced it—momentum and growth held up better while lower-volatility, dividend, value, and quality lagged. Investors weren’t fleeing risk; they were compressing risk into what’s already worked.
Rates remained a quiet but powerful constraint. The 10-year yield stayed volatile within the broader 3.6%–4.2% range, and the market’s sensitivity increased as yields pushed toward the upper end of that band. Rising yields into catalysts tends to create a “tap the brakes” environment—one where markets don’t crash, but they become less forgiving, especially for over-owned trades and rate-sensitive growth.
Catalysts then arrived in sequence. Early-week corporate activity helped sentiment in pockets tied to AI infrastructure and dealmaking, and flow/positioning dynamics supported names caught up in index-related headlines. Macro and policy inputs added to the volatility: labor data that read “cooling-but-not-cracking,” and tariff-related tone shifts that temporarily eased supply-chain anxiety—moves that can quickly swing semis and the most sensitive leadership stocks.
Then came the main event: on December 10, the Fed cut 25 bps to 3.50%–3.75%, but the market’s real takeaway was the path forward. A notably divided vote and projections implying a slower pace—only one additional cut penciled in for 2026—tempered the “easy policy is back” narrative. Financials absorbed that message constructively, while rate-sensitive growth felt more constrained as yields continued to act as a ceiling.
Finally, this week’s earnings calendar matters because it spans the real economy. Housing and consumer names will help confirm whether demand is softening or simply normalizing, while tech and industrial-adjacent reporters can feed directly into the AI capex debate. Names on deck include Lennar and KB Home (housing), General Mills and Conagra (staples), Micron, Accenture, and Jabil (tech/IT cycle), FedEx (global activity barometer), Nike, CarMax, Darden, and Birkenstock (consumer health), Paychex (employment pulse), and Carnival/Winnebago (discretionary spending trends).
Sentiment is best described as “still optimistic, but less forgiving.” The surface calm of low volatility and near-record index levels is masking something more important: the market is rotating from a world where “own the leaders and ignore the rest” was enough, toward a world where expectations, valuations, and rates are forcing more discrimination.
That’s why a modest down day can feel heavier than the percentages suggest. When the market is narrow, the marginal seller matters more, and a selloff in leadership can ripple across confidence—even if yields are cooperating and there’s no single macro shock. This is how late-cycle tapes often behave: not consistently bearish, but increasingly selective, with sharper punishments for crowded trades and thinner support underneath.
I’m staying in the market-neutral camp here. Momentum has deteriorated, the risk remains that rates stay higher for longer, and unemployment is ticking up just enough to keep the Fed data-dependent rather than decisively dovish. Low volatility can create a false sense of safety—especially when breadth is weak and leadership is narrow—so this is not the environment where I want to be maximally exposed simply because indices are near highs.
From a practical roadmap standpoint, I can absolutely see a path where SPY grinds toward 680–700 if leadership stabilizes and the market leans into the idea of continued growth with a gentle easing cycle. But the more important near-term map is support: 620–640 is the zone that matters over the next few months. If we’re going to get a healthy advance rather than a brittle one, the market needs to prove it can hold that floor during inevitable pullbacks—and ideally broaden participation beyond a handful of tech winners.
So the playbook is discipline and selectivity. I want exposure that earns its place—either because it benefits from the current rate regime, or because it can withstand a world where AI infrastructure spending gets questioned, not celebrated. This week’s earnings slate is a perfect stress test for that: watch what companies say about demand, pricing power, and—most importantly—capex intentions. In a market this concentrated, the next durable move won’t be driven by hope alone; it’ll be driven by guidance that validates (or challenges) the assumptions already embedded in today’s valuations.
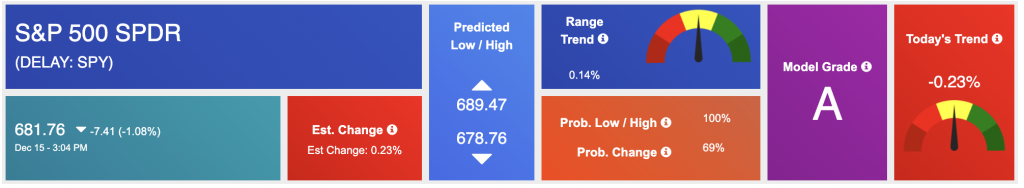
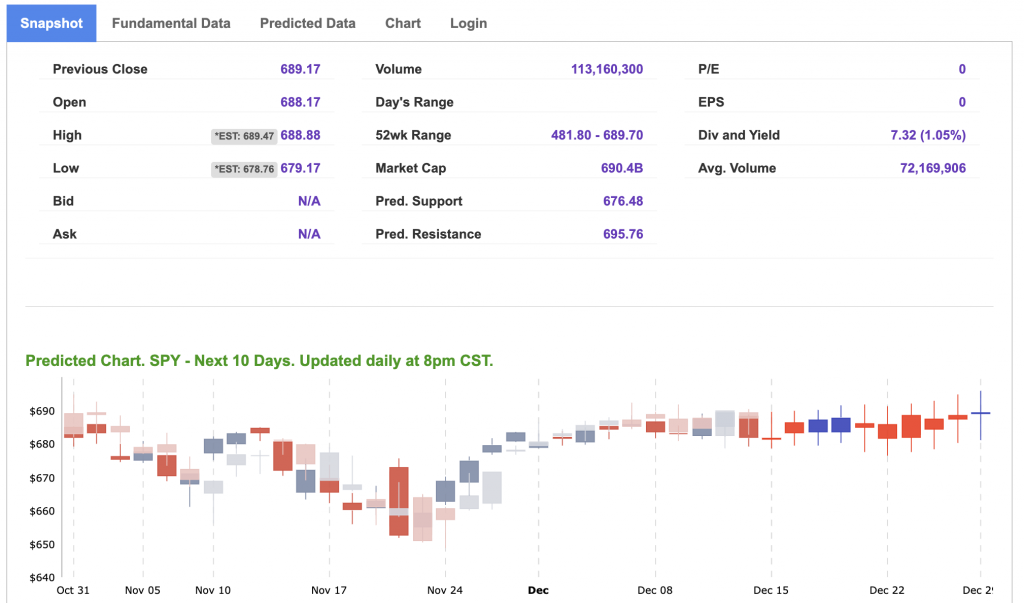
Using the “SPY” symbol to analyze the S&P 500, our 10-day prediction window shows a near-term positive outlook. Prediction data is uploaded after the market closes at 6 p.m. CST. Today’s data is based on market signals from the previous trading session.
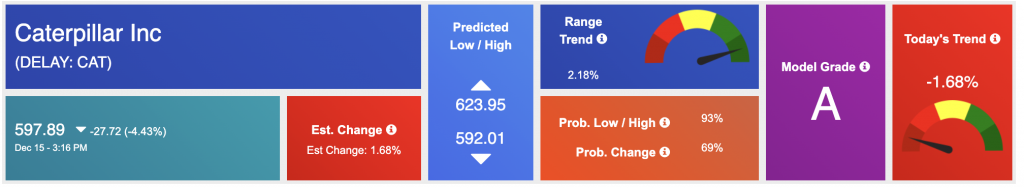
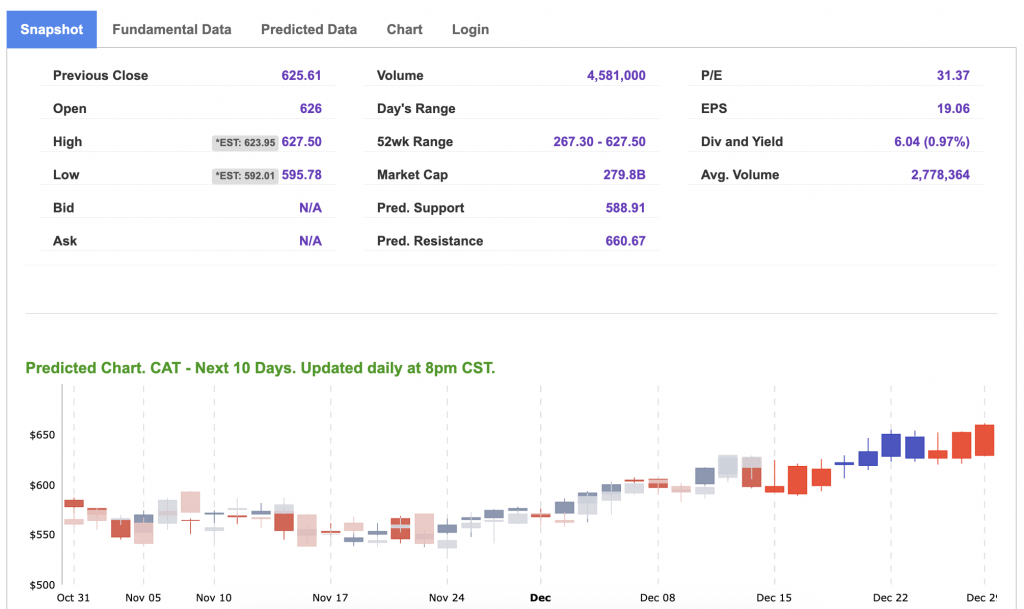
Our featured symbol for Tuesday is CAT. Caterpillar (CAT) is showing a steady vector in our Stock Forecast Toolbox’s 10-day forecast.
The symbol is trading at $597.89 with a vector of -1.68% at the time of publication.
10-Day Prediction data is uploaded after the market close at 6 p.m., CST. Today’s data is based on market signals from the previous trading session.
Note: The Vector column calculates the change of the Forecasted Average Price for the next trading session relative to the average of actual prices for the last trading session. The column shows the expected average price movement “Up or Down”, in percent. Trend traders should trade along the predicted direction of the Vector. The higher the value of the Vector the higher its momentum.
*Please note: At the time of publication, Vlad Karpel does have a position in the featured symbol, CAT. Our featured symbol is part of your free subscription service. It is not included in any paid Tradespoon subscription service. Vlad Karpel only trades his money in paid subscription services. If you are a paid subscriber, please review your Premium Member Picks, ActiveTrader, or MonthlyTrader recommendations. If you are interested in receiving Vlad’s picks, please click here.
West Texas Intermediate for Crude Oil delivery (CL.1) is priced at $56.61 per barrel, down 1.44%, at the time of publication.
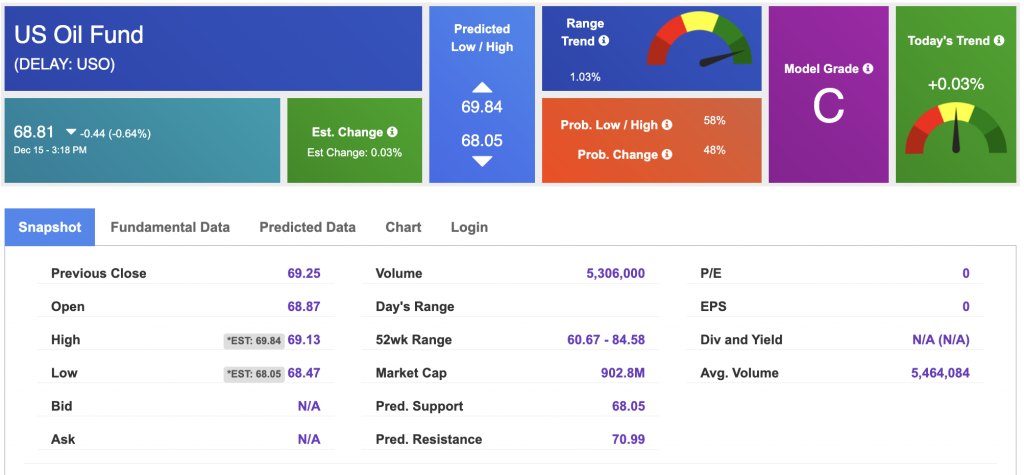
Looking at USO, a crude oil tracker, our 10-day prediction model shows mixed signals. The fund is trading at $68.81 at the time of publication. Prediction data is uploaded after the market close at 6 p.m., CST. Today’s data is based on market signals from the previous trading session.
The price for the Gold Continuous Contract (GC00) is up 0.09% at $4,332.10 at the time of publication.
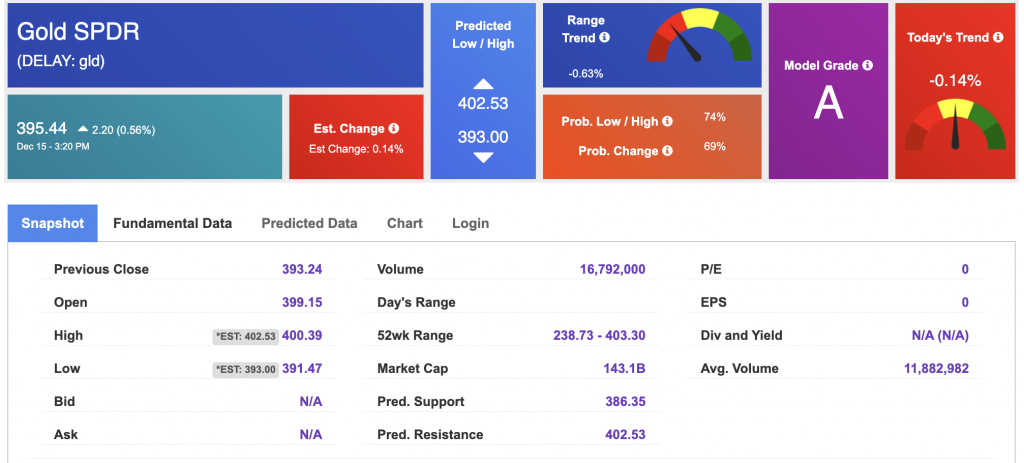
Using SPDR GOLD TRUST (GLD) as a tracker in our Stock Forecast Tool, the 10-day prediction window shows mixed signals. The gold proxy is trading at $395.44 at the time of publication. Vector signals show -0.14% for today. Prediction data is uploaded after the market close at 6 p.m., CST. Today’s data is based on market signals from the previous trading session.
The yield on the 10-year Treasury note is down at 4.183% at the time of publication.
The yield on the 30-year Treasury note is up at 4.852% at the time of publication.
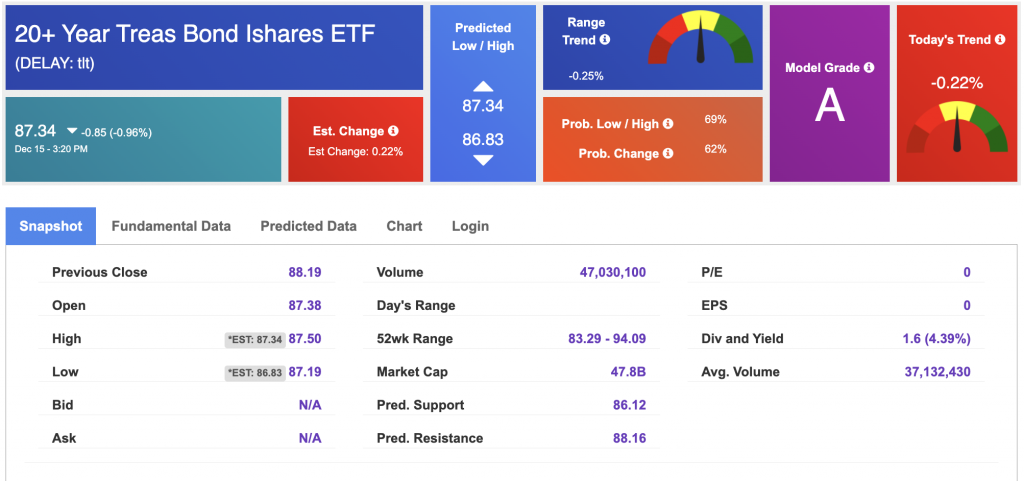
Using the iShares 20+ Year Treasury Bond ETF (TLT) as a proxy for bond prices in our Stock Forecast Tool, we see mixed signals in our 10-day prediction window. Prediction data is uploaded after the market close at 6 p.m., CST. Today’s data is based on market signals from the previous trading session.
The CBOE Volatility Index (^VIX) is priced at $16.50 at the time of publication, and our 10-day prediction window shows mixed signals. Prediction data is uploaded after the market close at 6 p.m., CST. Today’s data is based on market signals from the previous trading session.
Please share this Tradespoon Market Commentary with your friends.
![]()

![]()
Comments Off on


Tradespoon Tools make finding winning trades in minute as easy as 1-2-3.
Our simple 3 step approach has resulted in an average return of almost 20% per trade!

