 Special Offer: Try the 'Vlad's Portfolio Membership' for ONLY $37!
CLICK HERE TO LEARN MORE
Special Offer: Try the 'Vlad's Portfolio Membership' for ONLY $37!
CLICK HERE TO LEARN MORE
Stocks are trying to stabilize near key technical levels, but a Middle East oil disruption, a surprise jump in manufacturing prices, and a 10-year yield back above 4% are tightening financial conditions fast. With the Strait of Hormuz effectively stalled and inflation signals resurfacing, markets are being forced to reprice risk in real time.
Markets entered March exactly where February left off — highly sensitive to rates, macro data, and now, an escalating geopolitical shock layered on top.
By midday Monday, the S&P 500 was fluctuating between modest gains and losses, recently up about 0.2%. The Dow Jones Industrial Average hovered near flat, while the Nasdaq Composite managed a firmer gain of roughly 0.5%. That relative outperformance in tech, despite rising yields, reflects how tactical this tape has become. Investors are trading headlines and data in real time rather than making sweeping allocation shifts.
But beneath the surface, the tone is far more complex.
Over the weekend and into Monday, tensions in the Middle East escalated sharply following coordinated U.S. and Israeli strikes on Iranian targets. Iran has retaliated, and conflict has expanded into Lebanon, with missile exchanges and further military escalation. The accidental downing of U.S. aircraft and refinery disruptions have added to the intensity of the headlines.
The most market-relevant development: the effective closure of the Strait of Hormuz, a narrow waterway responsible for roughly 20% of global oil transit. Traffic has slowed to a near standstill.
Brent crude initially surged, briefly touching $80 per barrel before pulling back slightly. However, the real concern is duration. J.P. Morgan estimates that if the Strait remains effectively closed for more than three weeks, Brent could spike into the $100–$120 range.
That scenario is not just about energy profits — it is about inflation.
Oil-sensitive names such as Exxon Mobil and Chevron moved higher Monday, reflecting both higher crude prices and the defensive appeal of out-of-region energy exposure. Strategists increasingly view non-Gulf energy producers as a hedge should the Persian Gulf supply remain constrained.
The geopolitical overlay has injected a new variable into an already rate-sensitive market: supply-side inflation risk.
Perhaps the more important development on Monday was not in equities — it was in Treasuries.
The yield on the 10-year Treasury climbed to 4.055%, rising more than 10 basis points on the session. That move matters.
Historically, geopolitical stress pushes investors toward Treasuries as a safe haven. Instead, yields rose. That signals inflation concern rather than pure risk aversion. Investors are demanding higher compensation to hold long-duration assets.
The move was amplified by economic data.
The Institute for Supply Management’s Manufacturing PMI came in at 52.4 for February, slightly below January’s 52.6 but well above the 51.8 economists had expected.
This marks the second consecutive month of expansion following a prolonged contractionary stretch that defined much of the prior two years. On its face, that is constructive. Manufacturing is stabilizing.
However, the details complicate the picture.
The prices-paid component surged to its highest level since June 2022, jumping 11.5 percentage points from January. That is a meaningful inflation signal.
Solid growth combined with rising input costs reinforces the Federal Reserve’s cautious stance. As we discussed on Friday, policymakers are already hesitant to signal rate cuts following January’s strong 256,000 payroll gain and persistent wage pressure. Monday’s data makes an early pivot even less likely.
This explains why yields climbed rather than fell in response to geopolitical stress. The bond market is increasingly concerned about inflation persistence — not economic collapse.
The result is a market caught between opposing forces:
• Geopolitical risk that should, in theory, favor safety
• Manufacturing growth that supports economic resilience
• Rising input costs that threaten inflation reacceleration
• Treasury yields are climbing instead of declining
That tension explains the choppy intraday action.
The Nasdaq’s relative strength despite higher yields suggests that investors are not abandoning growth — they are simply trading tactically around rate volatility. Meanwhile, energy’s strength reflects both supply disruption and inflation hedging.
The broader pattern remains consistent with what we outlined Friday: this is no longer a liquidity-driven rally. It is a fundamentals-and-rates-driven environment.
The S&P 500 remains near its 50-day moving average. Momentum is cooling beneath the surface. Leadership is narrowing. Volatility remains elevated but orderly.
Now, the added variable of oil-driven inflation risk has entered the equation.
This week was already scheduled to be macro-heavy, with ISM Services, JOLTS, ADP, and Friday’s Employment Situation Report on deck. After Monday’s inflation-sensitive ISM reading and rising oil prices, those labor figures carry even greater weight.
If payrolls remain strong and wages stay firm, yields could press back toward the upper end of their established 3.6%–4.35% range. If oil continues climbing simultaneously, the inflation narrative may reaccelerate quickly.
Conversely, a softer labor print could provide relief to rate-sensitive sectors and help stabilize equity multiples.
For now, the message is clear: Markets are not panicking, but they are recalibrating in real time. Energy is acting as a hedge. Bonds are signaling inflation vigilance. Equities are balancing resilience against valuation compression.
In this environment, discipline matters more than prediction. Position sizing, sector balance, and sensitivity to rate moves remain critical as the tape responds less to optimism and more to incremental data and geopolitical duration.
March has opened with complexity, and the fulcrum remains yields.
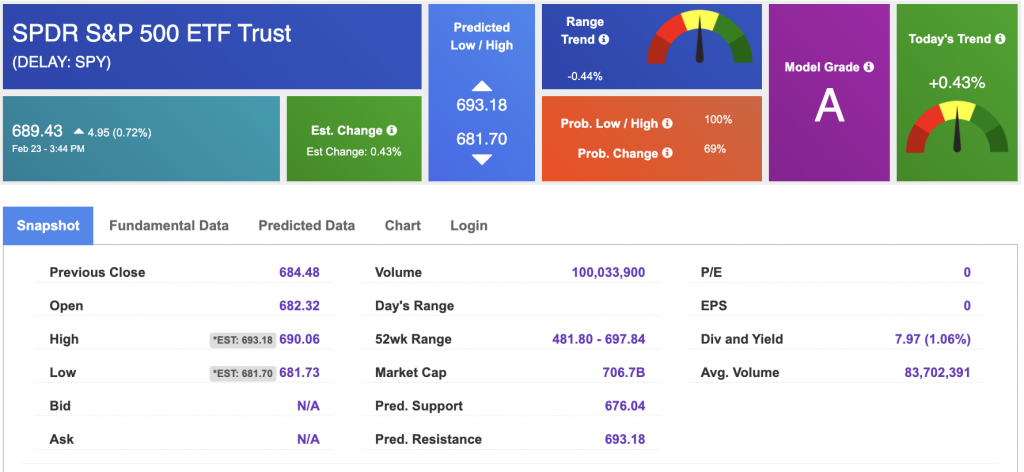
Using the “SPY” symbol to analyze the S&P 500, our 10-day prediction window shows a near-term positive outlook. Prediction data is uploaded after the market closes at 6 p.m. CST. Today’s data is based on market signals from the previous trading session.
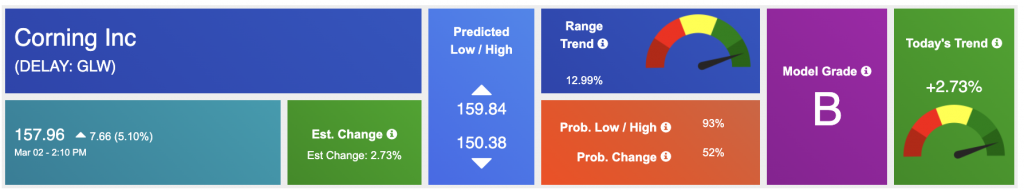
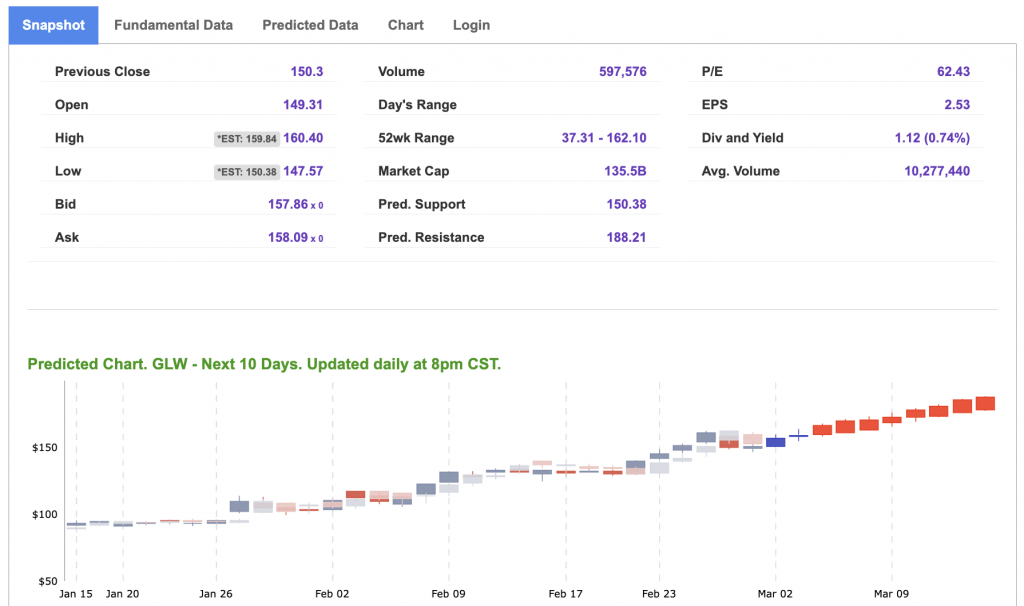
Our featured symbol for Tuesday is GLW. Corning Inc. (GLW) is showing a steady vector in our Stock Forecast Toolbox’s 10-day forecast.
The symbol is trading at $157.96 with a vector of +2.73% at the time of publication.
10-Day Prediction data is uploaded after the market close at 6 p.m., CST. Today’s data is based on market signals from the previous trading session.
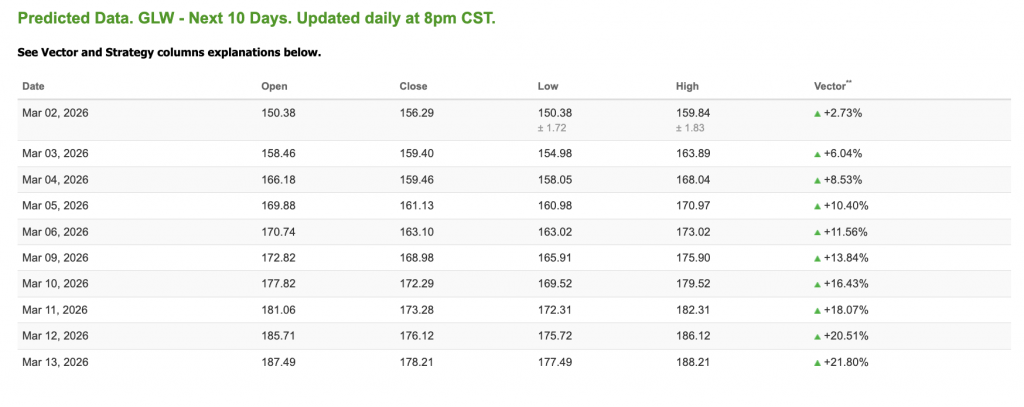
Note: The Vector column calculates the change of the Forecasted Average Price for the next trading session relative to the average of actual prices for the last trading session. The column shows the expected average price movement “Up or Down”, in percent. Trend traders should trade along the predicted direction of the Vector. The higher the value of the Vector the higher its momentum.
*Please note: At the time of publication, Vlad Karpel does have a position in the featured symbol, GLW. Our featured symbol is part of your free subscription service. It is not included in any paid Tradespoon subscription service. Vlad Karpel only trades his money in paid subscription services. If you are a paid subscriber, please review your Premium Member Picks, ActiveTrader, or MonthlyTrader recommendations. If you are interested in receiving Vlad’s picks, please click here.
West Texas Intermediate for Crude Oil delivery (CL.1) is priced at $72.56 per barrel, up 8.15%, at the time of publication.
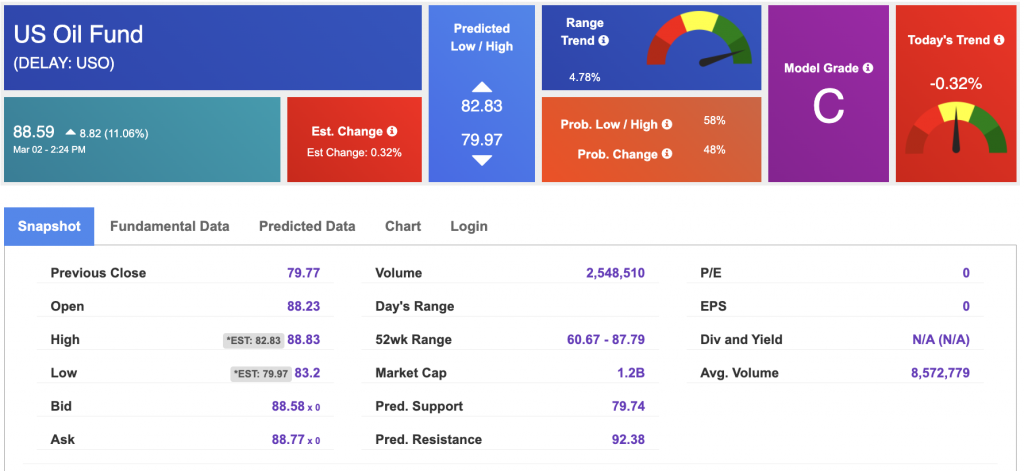
Looking at USO, a crude oil tracker, our 10-day prediction model shows mixed signals. The fund is trading at $88.59 at the time of publication. Prediction data is uploaded after the market close at 6 p.m., CST. Today’s data is based on market signals from the previous trading session.
The price for the Gold Continuous Contract (GC00) is up 1.89% at $5,348.50 at the time of publication.
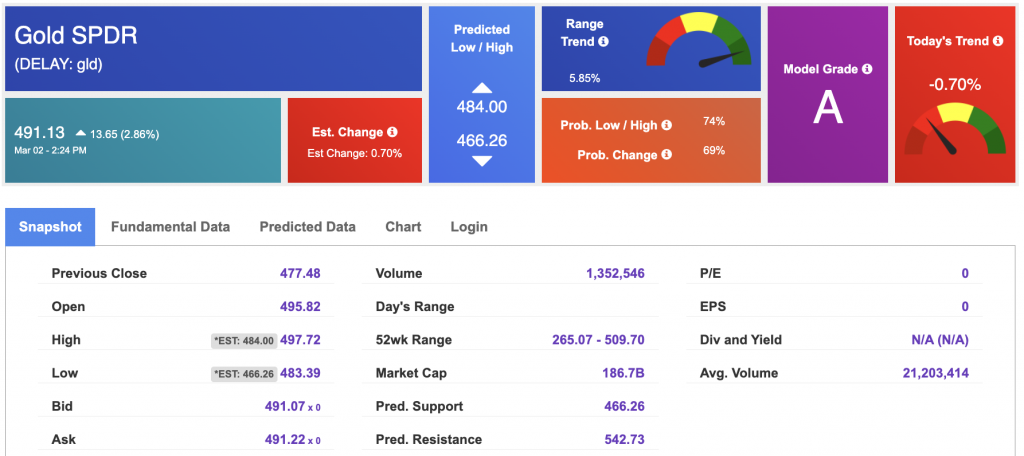
Using SPDR GOLD TRUST (GLD) as a tracker in our Stock Forecast Tool, the 10-day prediction window shows mixed signals. The gold proxy is trading at $491.13 at the time of publication. Vector signals show -0.70% for today. Prediction data is uploaded after the market close at 6 p.m., CST. Today’s data is based on market signals from the previous trading session.
The yield on the 10-year Treasury note is up at 4.051% at the time of publication.
The yield on the 30-year Treasury note is up at 4.699% at the time of publication.
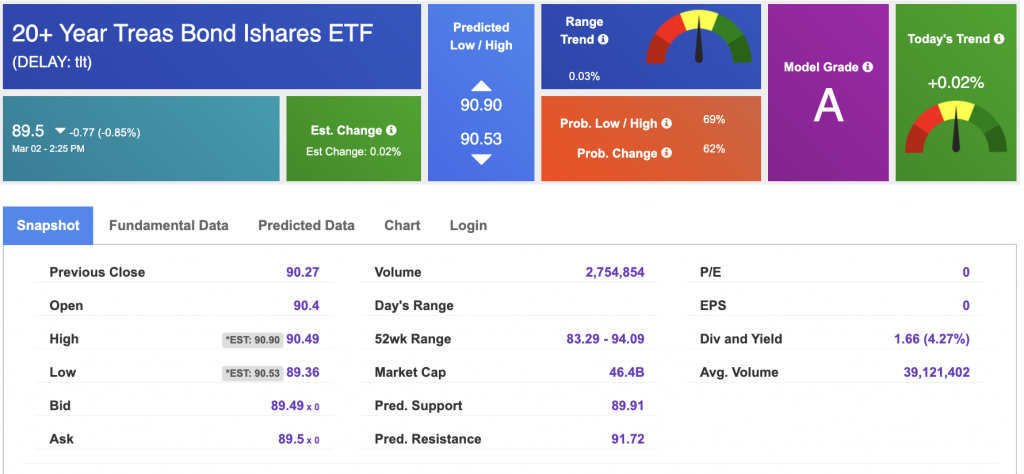
Using the iShares 20+ Year Treasury Bond ETF (TLT) as a proxy for bond prices in our Stock Forecast Tool, we see mixed signals in our 10-day prediction window. Prediction data is uploaded after the market close at 6 p.m., CST. Today’s data is based on market signals from the previous trading session.
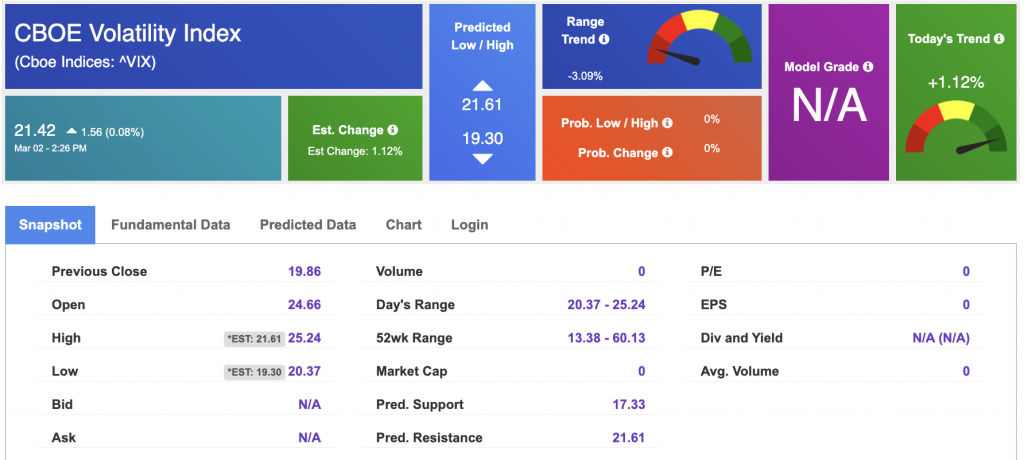
The CBOE Volatility Index (^VIX) is priced at $21.42 at the time of publication, and our 10-day prediction window shows mixed signals. Prediction data is uploaded after the market close at 6 p.m., CST. Today’s data is based on market signals from the previous trading session.
Please share this Tradespoon Market Commentary with your friends.
![]()

![]()
Comments Off on


Tradespoon Tools make finding winning trades in minute as easy as 1-2-3.
Our simple 3 step approach has resulted in an average return of almost 20% per trade!

