 Special Offer: Try the 'SpreadTrader Membership' for ONLY $37!
CLICK HERE TO LEARN MORE
Special Offer: Try the 'SpreadTrader Membership' for ONLY $37!
CLICK HERE TO LEARN MORE
Stocks entered the week on unstable footing as oil surged above $110 following escalating Middle East tensions. The spike is reviving inflation concerns just as markets hoped price pressures were cooling, while the S&P 500 sits near key technical support. With CPI, PPI, and consumer sentiment data arriving in the coming days, investors are bracing for a volatile tug-of-war between geopolitical risk and economic resilience.
Markets opened the week under renewed pressure as geopolitical risk returned to the center of the macro narrative. After attempting to stabilize late last week, investors were hit on Monday with a fresh shock as crude oil surged above $110 per barrel. The move triggered a broad risk-off reaction across global markets, with Dow futures falling roughly 600 points while S&P 500 and Nasdaq futures slipped about 1%. Weakness spread internationally as well, with major Asian indices—including India’s Sensex and Nifty—dropping close to 2%.
The catalyst remains escalating tensions involving Iran, Israel, and the United States. Investors fear potential disruptions to energy supply routes in the Middle East, particularly the Strait of Hormuz, one of the world’s most critical oil transit chokepoints. Even the perception of risk to this corridor has been enough to drive crude sharply higher.
For markets already navigating a fragile macro backdrop, the oil surge introduces another inflation variable. Higher energy prices can ripple through transportation, manufacturing, and consumer spending, potentially complicating the Federal Reserve’s policy path just as investors had begun hoping inflation pressures were stabilizing.
Interest rates remain central to the market’s reaction. Treasury yields have been moving within a broad range, and equity valuations—particularly in growth sectors—remain highly sensitive to any shift in inflation expectations. When energy prices spike, markets quickly reassess the likelihood of near-term policy easing.
In that sense, the oil rally is not merely a commodity story but a macro shock affecting equities, bonds, and currencies simultaneously as investors recalibrate expectations around inflation, growth, and monetary policy.
Volatility therefore remains elevated. The VIX continues to trade above its calm-market baseline, signaling uncertainty rather than systemic panic. Market behavior still reflects rotation and repricing rather than broad liquidation, though intraday swings have become more pronounced.
Sector performance is already reflecting the shift. Energy companies have been among the strongest performers as higher crude prices boost revenue expectations across the sector. Refiners, oil-service firms, and integrated producers are drawing renewed investor attention as markets reassess earnings potential tied to the commodity rally.
At the same time, rate-sensitive growth stocks continue to face pressure whenever yields rise. The Nasdaq’s recent weakness reflects investors rotating away from valuation-sensitive companies toward businesses with stronger cash-flow resilience. Defensive sectors such as utilities, consumer staples, and healthcare may also see inflows if volatility persists.
Beyond geopolitics, the economic calendar this week could play an equally important role in shaping sentiment. A series of inflation and labor-market reports will offer clues about the trajectory of both the economy and Federal Reserve policy.
The Consumer Price Index will be the most closely watched release as investors assess whether rising energy costs are feeding into broader inflation measures. Shortly afterward, the Producer Price Index will provide insight into upstream cost pressures that could eventually reach consumers.
Labor-market indicators will also be important. Weekly jobless claims will provide a timely snapshot of employment conditions, while Friday’s University of Michigan Consumer Sentiment report may offer clues about how households are responding to rising energy costs and economic uncertainty.
Corporate earnings, though past their peak reporting period, will still provide useful insight. Technology companies tied to cloud infrastructure, networking, and semiconductors will be closely watched given recent growth-stock volatility, while firms connected to oilfield services and refining may attract attention as investors gauge how durable the commodity rally may become. Financial companies reporting this week may also offer commentary on credit conditions and loan demand.
From a technical standpoint, the broader market structure remains intact but increasingly fragile. The S&P 500 continues hovering near its 50-day moving average as buyers defend support while sellers respond to macro uncertainty. SPY support in the 650–660 range remains a key floor; as long as this level holds, the broader uptrend stays structurally intact despite elevated volatility. If yields stabilize and inflation pressures do not accelerate significantly, the rally could still extend toward the 700–720 range over time.
In the near term, however, markets must navigate a challenging combination of geopolitical tension, elevated interest rates, and a global liquidity backdrop that is no longer expanding. As a result, leadership is increasingly shifting toward companies with strong earnings, durable cash flows, and solid balance sheets.
This transition toward a more fundamentals-driven market does not necessarily signal a downturn, but it does imply continued volatility and sector rotation. With inflation data and developments in the Middle East likely to guide sentiment this week, disciplined and selective positioning may matter more than broad market exposure.
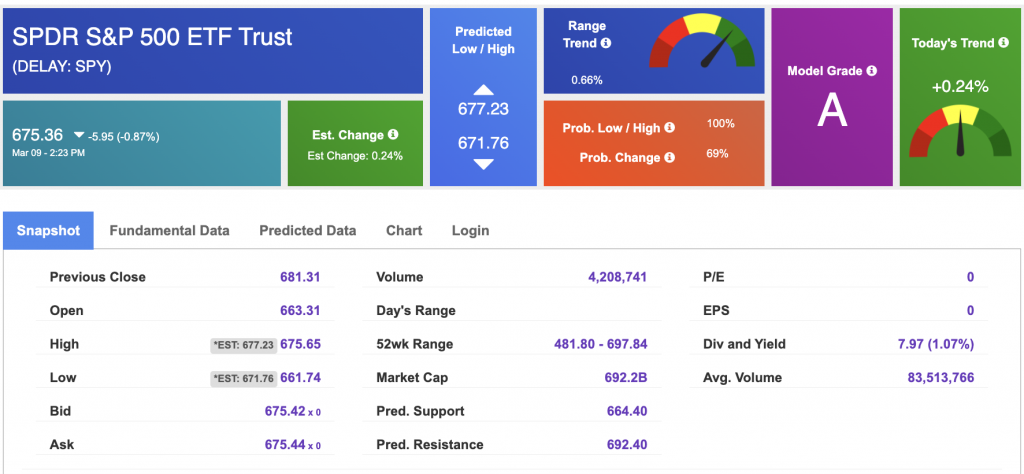
Using the “SPY” symbol to analyze the S&P 500, our 10-day prediction window shows a near-term positive outlook. Prediction data is uploaded after the market closes at 6 p.m. CST. Today’s data is based on market signals from the previous trading session.
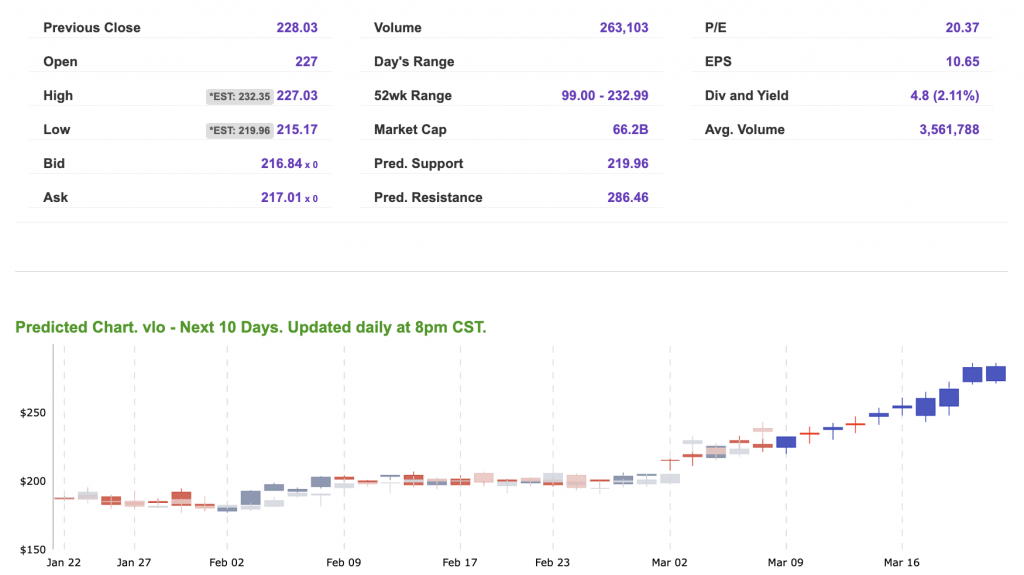
Our featured symbol for Tuesday is VLO. Valero Energy Corp. (VLO) is showing a steady vector in our Stock Forecast Toolbox’s 10-day forecast.
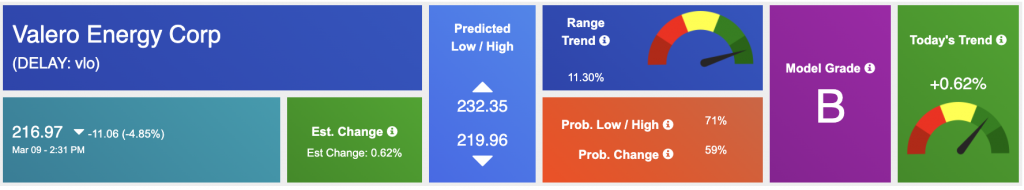
The symbol is trading at $216.97 with a vector of +0.62% at the time of publication.
10-Day Prediction data is uploaded after the market close at 6 p.m., CST. Today’s data is based on market signals from the previous trading session.
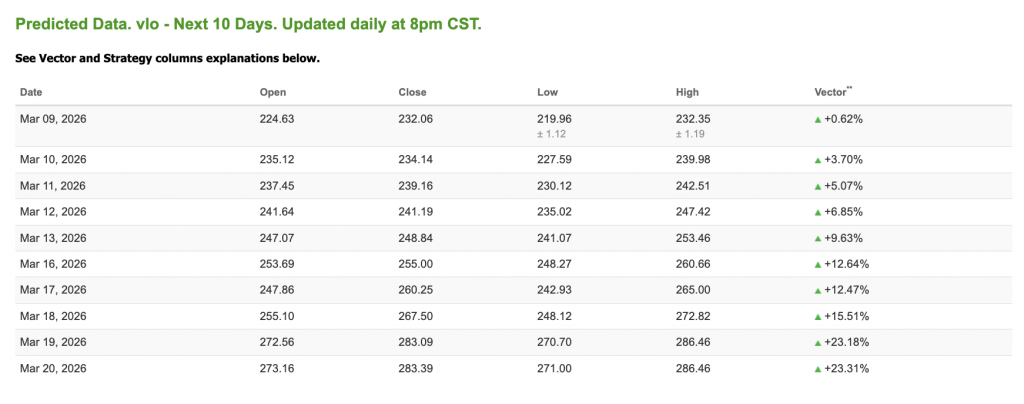
Note: The Vector column calculates the change of the Forecasted Average Price for the next trading session relative to the average of actual prices for the last trading session. The column shows the expected average price movement “Up or Down”, in percent. Trend traders should trade along the predicted direction of the Vector. The higher the value of the Vector the higher its momentum.
*Please note: At the time of publication, Vlad Karpel does have a position in the featured symbol, VLO. Our featured symbol is part of your free subscription service. It is not included in any paid Tradespoon subscription service. Vlad Karpel only trades his money in paid subscription services. If you are a paid subscriber, please review your Premium Member Picks, ActiveTrader, or MonthlyTrader recommendations. If you are interested in receiving Vlad’s picks, please click here.
West Texas Intermediate for Crude Oil delivery (CL.1) is priced at $86.60 per barrel, down 4.73%, at the time of publication.
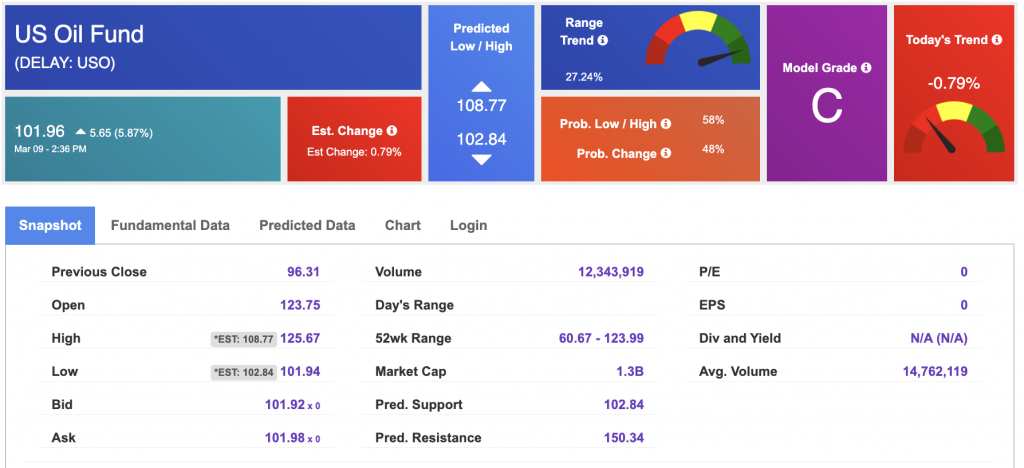
Looking at USO, a crude oil tracker, our 10-day prediction model shows mixed signals. The fund is trading at $101.96 at the time of publication. Prediction data is uploaded after the market close at 6 p.m., CST. Today’s data is based on market signals from the previous trading session.
The price for the Gold Continuous Contract (GC00) is down 0.32% at $5,141.70 at the time of publication.

Using SPDR GOLD TRUST (GLD) as a tracker in our Stock Forecast Tool, the 10-day prediction window shows mixed signals. The gold proxy is trading at $471.24 at the time of publication. Vector signals show -0.06% for today. Prediction data is uploaded after the market close at 6 p.m., CST. Today’s data is based on market signals from the previous trading session.
The yield on the 10-year Treasury note is down at 4.099% at the time of publication.
The yield on the 30-year Treasury note is down at 4.715% at the time of publication.
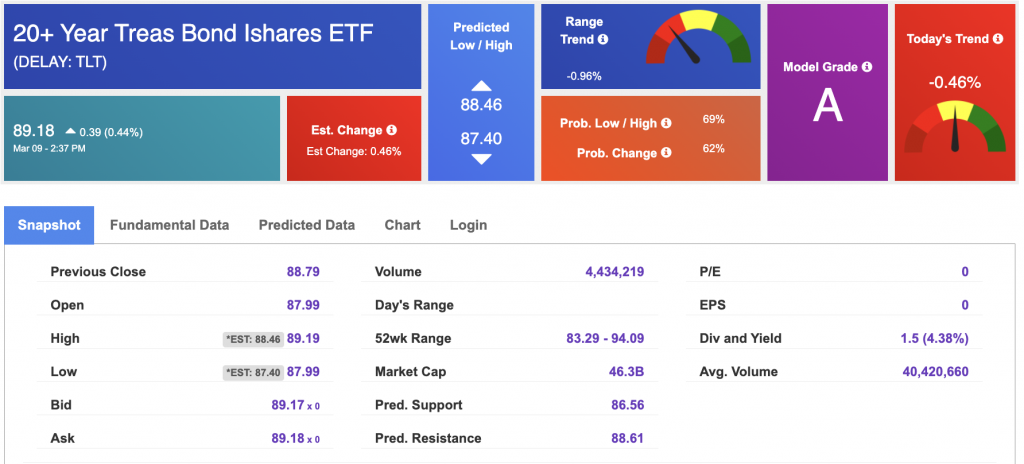
Using the iShares 20+ Year Treasury Bond ETF (TLT) as a proxy for bond prices in our Stock Forecast Tool, we see mixed signals in our 10-day prediction window. Prediction data is uploaded after the market close at 6 p.m., CST. Today’s data is based on market signals from the previous trading session.
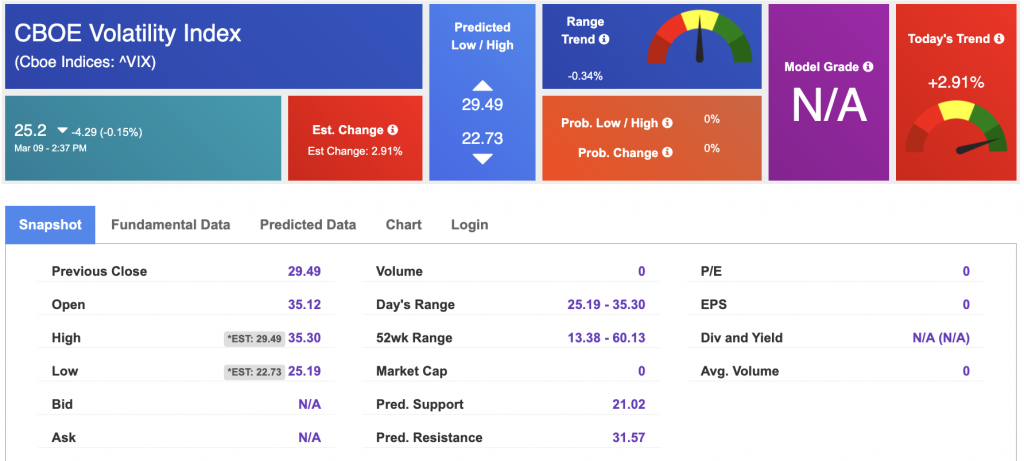
The CBOE Volatility Index (^VIX) is priced at $25.2 at the time of publication, and our 10-day prediction window shows mixed signals. Prediction data is uploaded after the market close at 6 p.m., CST. Today’s data is based on market signals from the previous trading session.
Please share this Tradespoon Market Commentary with your friends.
![]()

![]()
Comments Off on


Tradespoon Tools make finding winning trades in minute as easy as 1-2-3.
Our simple 3 step approach has resulted in an average return of almost 20% per trade!

