 Are you a Long-Term Trader? Then take a look at our NEW RoboInvestor Service?
CLICK HERE TO LEARN MORE
Are you a Long-Term Trader? Then take a look at our NEW RoboInvestor Service?
CLICK HERE TO LEARN MORE
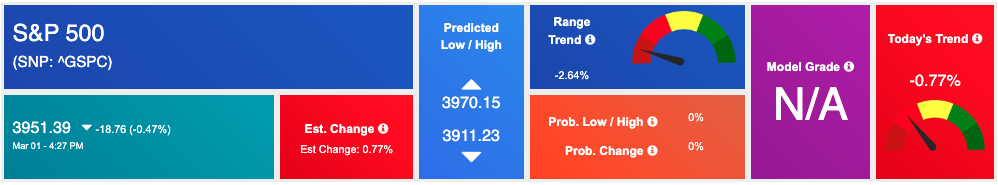
U.S. stocks began March on a mixed note as investors weighed hawkish comments from the Federal Reserve and slightly disappointing manufacturing data. The S&P 500 and Nasdaq both opened lower, with the benchmark 10-year Treasury yield topping 4% for the first time since November. Moreover, manufacturing activity contracted for the fourth consecutive month.
The decline was prompted by hawkish comments from the Minneapolis Federal Reserve President Neel Kashkari, who suggested that a more significant interest rate hike was likely. This sentiment was further compounded by the latest manufacturing data released by the Institute for Supply Management. The PMI for February came in at 47.7, a slight increase from January’s reading of 47.4 but below economists’ expectations of 47.8.
In addition, the day was marked by mixed results from several retail earnings reports. Lowe’s beat earnings expectations in the fourth quarter, but its stock price fell by 5.6%. Dollar Tree also topped estimates, but it provided disappointing guidance, causing its stock to rise only by 1%. Meanwhile, Kohl’s saw its stock price decline by 1.7% after the retailer reported a significant loss in the fourth quarter, which missed analysts’ estimates by a wide margin.
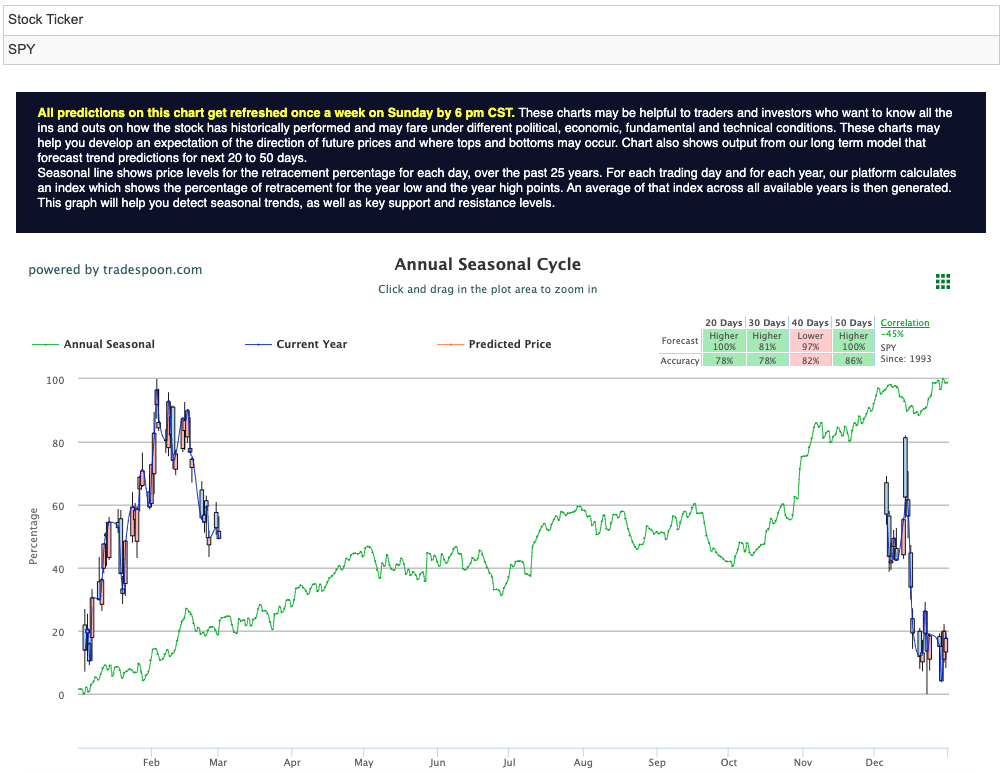
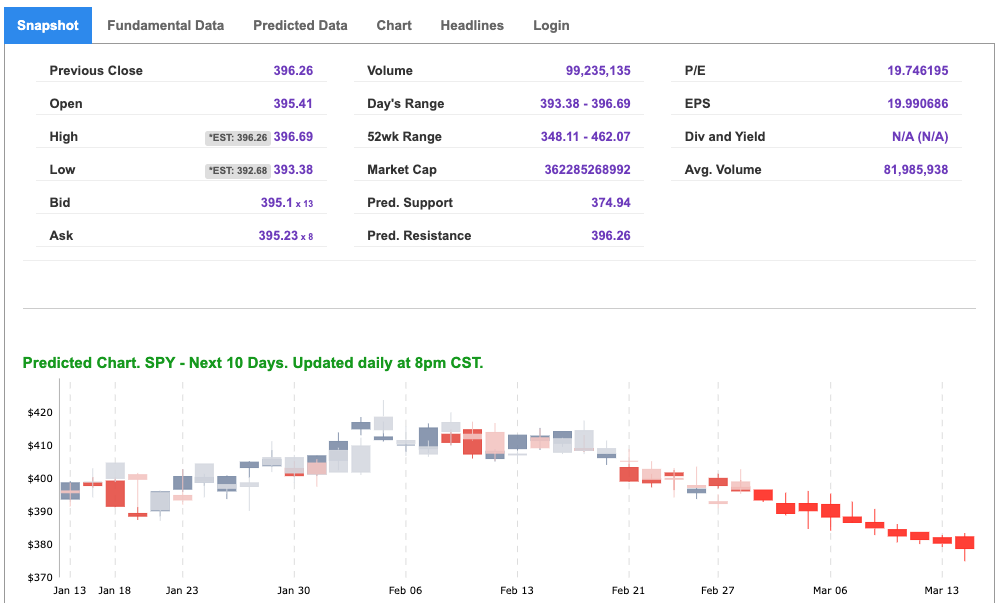
Looking ahead, the VIX is trading near the $21 level, and upcoming earnings reports from companies such as CRM, KR, and SPLK, as well as the ISM data, could influence the market’s next move. The focus will be on the overhead resistance levels in the SPY, which currently sit at $403 and then $408. The SPY support is at $395 and then $390. Despite the mixed trading session, experts are anticipating that the markets will trade sideways for the next two to eight weeks. As a result, investors are being encouraged to be market-neutral and hedge their positions. Market commentary readers should maintain clearly defined stop levels for all positions. For reference, the SPY Seasonal Chart is shown below:
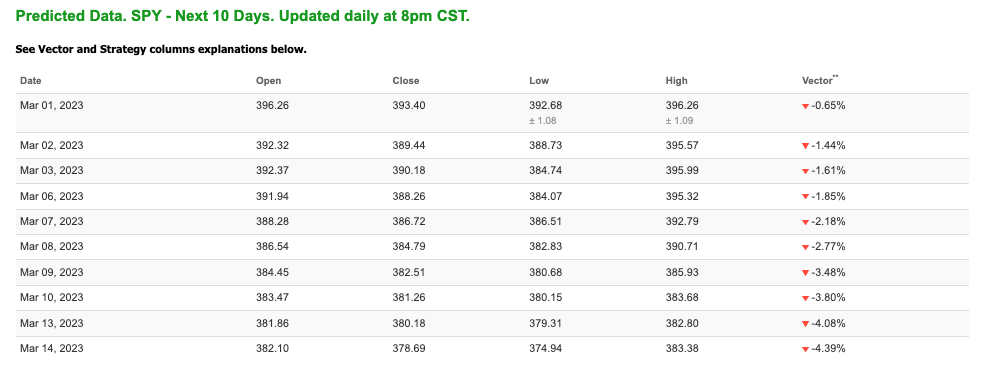
Note: The Vector column calculates the change of the Forecasted Average Price for the next trading session relative to the average of actual prices for the last trading session. The column shows the expected average price movement “Up or Down”, in percent. Trend traders should trade along the predicted direction of the Vector. The higher the value of the Vector the higher its momentum.
*Please note: At the time of publication Vlad Karpel does have a position in the featured symbol, spy. Our featured symbol is part of your free subscription service. It is not included in any paid Tradespoon subscription service. Vlad Karpel only trades his money in paid subscription services. If you are a paid subscriber, please review your Premium Member Picks, ActiveTrader, or MonthlyTrader recommendations. If you are interested in receiving Vlad’s picks, please click here.
West Texas Intermediate for Crude Oil delivery (CL.1) is priced at $77.72 per barrel, up 0.87%, at the time of publication.
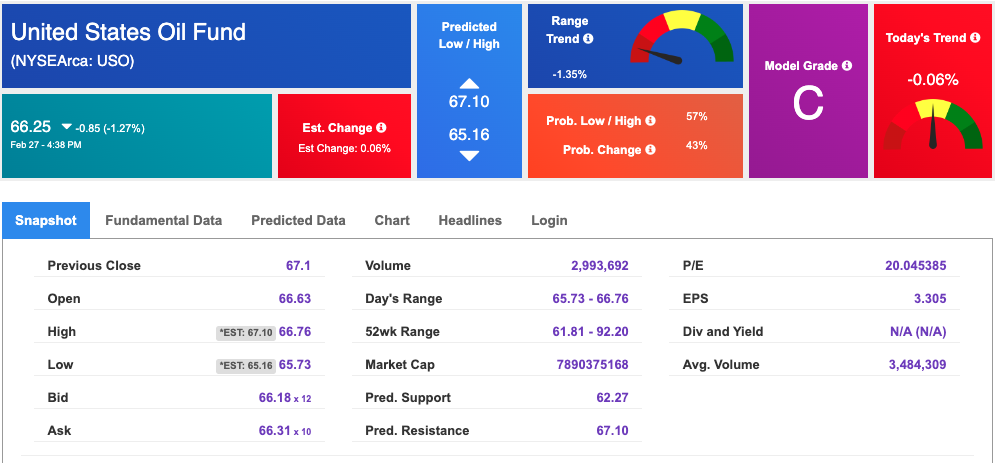
Looking at USO, a crude oil tracker, our 10-day prediction model shows mixed signals. The fund is trading at $66.25 at the time of publication. Prediction data is uploaded after the market close at 6 p.m., CST. Today’s data is based on market signals from the previous trading session.
The price for the Gold Continuous Contract (GC00) is up 0.38% at $1843.60 at the time of publication.
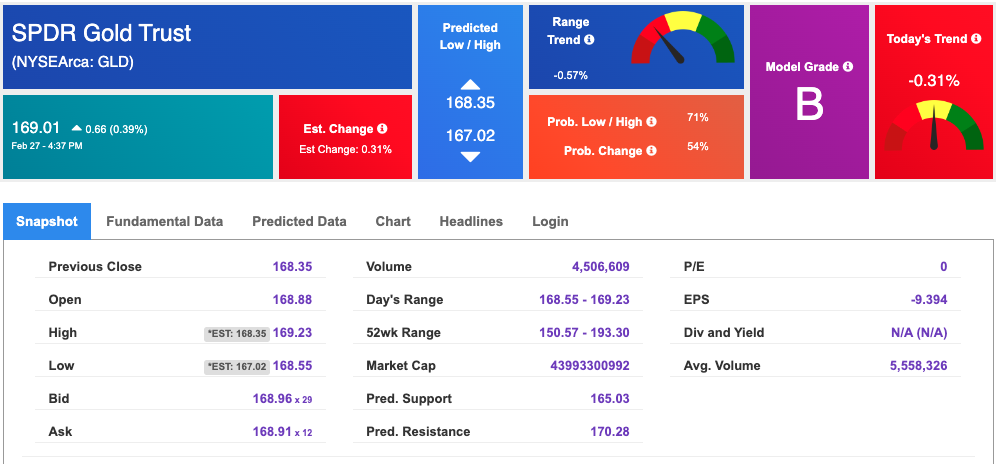
Using SPDR GOLD TRUST (GLD) as a tracker in our Stock Forecast Tool, the 10-day prediction window shows mixed signals. The gold proxy is trading at $169.01 at the time of publication. Vector signals show -0.31% for today. Prediction data is uploaded after the market close at 6 p.m., CST. Today’s data is based on market signals from the previous trading session.
The yield on the 10-year Treasury note is up at 3.995% at the time of publication.
The yield on the 30-year Treasury note is up at 3.957% at the time of publication.
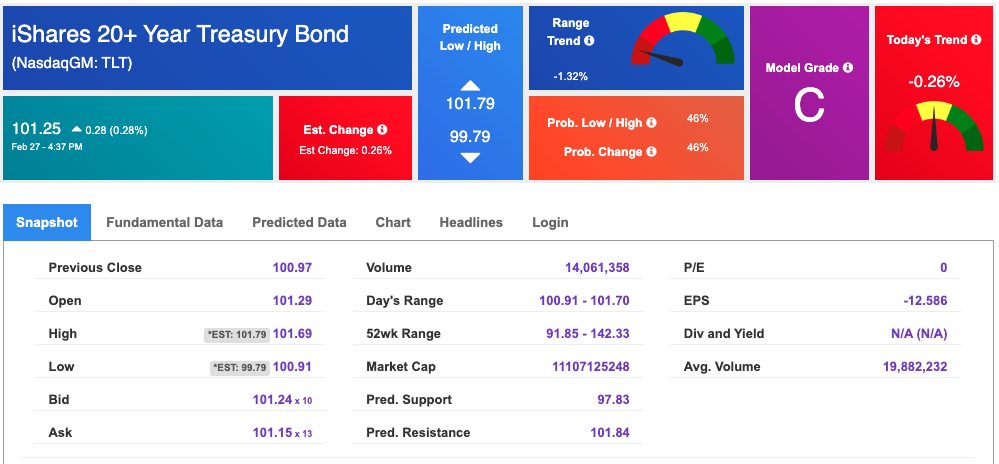
Using the iShares 20+ Year Treasury Bond ETF (TLT) as a proxy for bond prices in our Stock Forecast Tool, we see mixed signals in our 10-day prediction window. Prediction data is uploaded after the market close at 6 p.m., CST. Today’s data is based on market signals from the previous trading session.
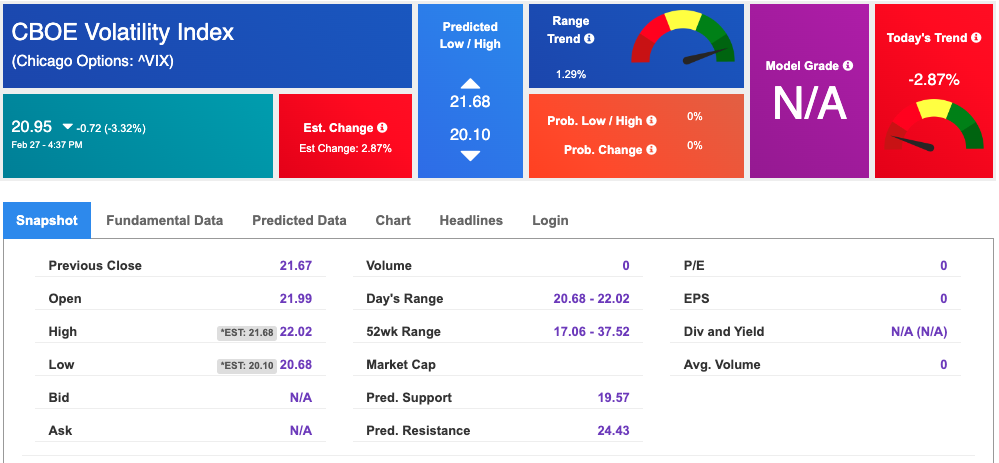
The CBOE Volatility Index (^VIX) is $20.95 at the time of publication, and our 10-day prediction window shows mixed signals. Prediction data is uploaded after the market close at 6 p.m., CST. Today’s data is based on market signals from the previous trading session.
Please share this Tradespoon Market Commentary with your friends.
![]()

![]()
Comments Off on


Tradespoon Tools make finding winning trades in minute as easy as 1-2-3.
Our simple 3 step approach has resulted in an average return of almost 20% per trade!

