 Special Offer: Try the 'Premium Membership' for ONLY $37!
CLICK HERE TO LEARN MORE
Special Offer: Try the 'Premium Membership' for ONLY $37!
CLICK HERE TO LEARN MORE
Last week’s rally, fueled by blockbuster tech earnings and a surprisingly resilient Q2 GDP print, came to an abrupt halt on Friday when the July nonfarm payrolls report disappointed. After surging to fresh all-time highs midweek—on the back of stellar results and guidance from Microsoft and Meta—the markets retraced sharply as employers added just 73,000 jobs versus expectations of 115,000. Downward revisions to May and June slashed a combined 258,000 positions, while the unemployment rate ticked up to 4.2% and wage growth cooled. Stocks sold off hard: the Dow fell more than 600 points, the S&P 500 dropped 1.5%, and the Nasdaq shed almost 2% as odds of a September rate cut swung wildly—from above 60% early in the week, down to 45% post-Powell, then back up above 70% after the jobs print.
MONDAY’S SNAPBACK
On Monday, investors shrugged off Friday’s pain, buying the dip in anticipation of imminent Fed easing. The Dow rebounded 424 points (1%), the S&P 500 climbed 1.2%, and the Nasdaq jumped 1.7%—marking a swift reversal that underscores the market’s desire for lower rates. Futures pointed higher into the open, suggesting that the latest labor-market weakness has crystallized expectations for rate cuts sooner rather than later. The Cboe VIX eased back below 20, settling around 19, signaling that traders felt less anxious about volatility after digesting the weak jobs data.
INDUSTRIAL PULSE
Amid equity gyrations, U.S. factory orders offered further evidence of a cooling economy. June orders fell 4.8% month-over-month to $611.7 billion—marking contraction in two of the last three months—though stripping out transportation softened the drop to a modest 0.4% gain. Defense-excluded orders still declined 4.7%, highlighting weakness beyond lumpy aerospace and military spending. Meanwhile, the Conference Board’s Employment Trends Index, a forward-looking gauge of labor conditions, fell to 107.55 in July—the lowest since October—reinforcing the narrative that hiring momentum is ebbing.
UTILITY OF A.I. FORECASTS
At Tradespoon, our A.I. models continue to flag critical levels and guide positioning through these whipsaws. SPY remains wedged between support in the $580–$590 zone and resistance up near $630–$640. With sentiment oscillating from exuberance to caution and back again, we remain vigilant for any break beyond these thresholds. A sustained move below $580 could trigger a deeper pullback, while a decisive rally above $640 would signal renewed risk appetite.
LOOKING AHEAD
With no Fed meeting in August, all eyes turn to the Jackson Hole Symposium on August 22, where Chair Powell’s remarks could tip the scales on September policy. Between now and then, a steady cadence of data and earnings awaits: factory orders follow-up, ISM services, productivity metrics, and consumer credit figures will shine additional light on the growth-inflation balance. On the corporate front, Palantir, BP, Pfizer, Yum!, DoorDash, DraftKings, Lyft, MetLife, Sony, Uber, Constellation Brands, Eli Lilly, Warner Bros. Discovery, and Yelp are all set to report, offering fresh catalysts for sector rotations.
Investors would be wise to stay nimble: in an environment swinging between growth scares and monetary relief hopes, diversified positioning and strict risk management remain paramount. We’ll be parsing every data release and Powell soundbite to adapt our models—and our portfolios—through what promises to be a pivotal month.
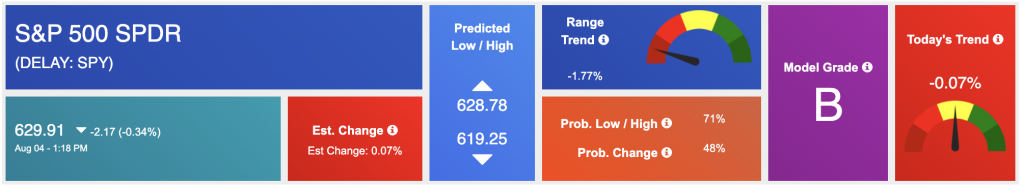
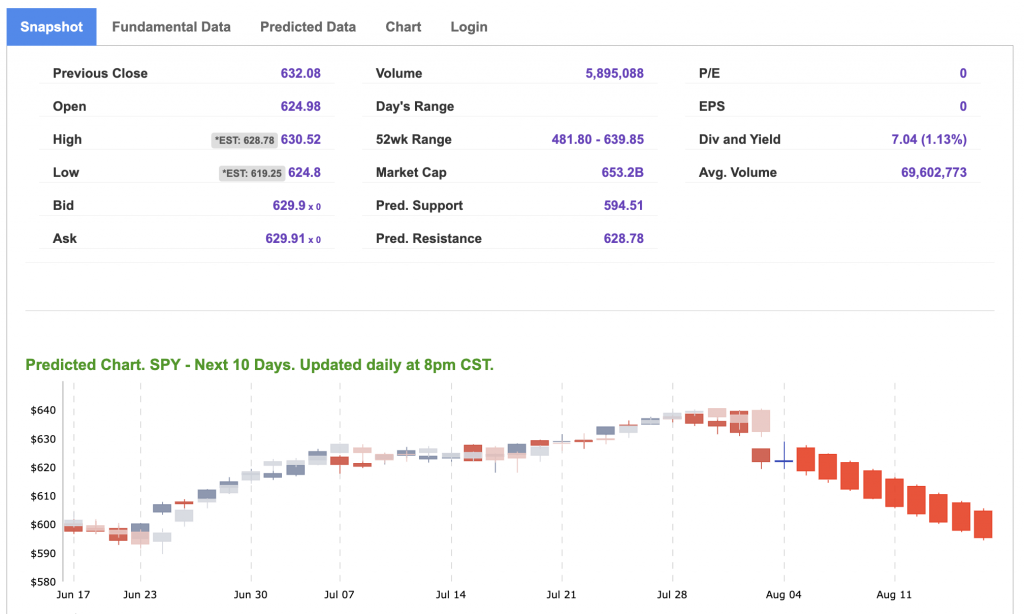
Using the “SPY” symbol to analyze the S&P 500, our 10-day prediction window shows a near-term positive outlook. Prediction data is uploaded after the market closes at 6 p.m. CST. Today’s data is based on market signals from the previous trading session.
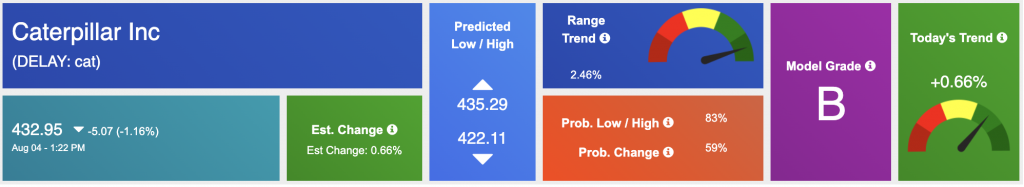
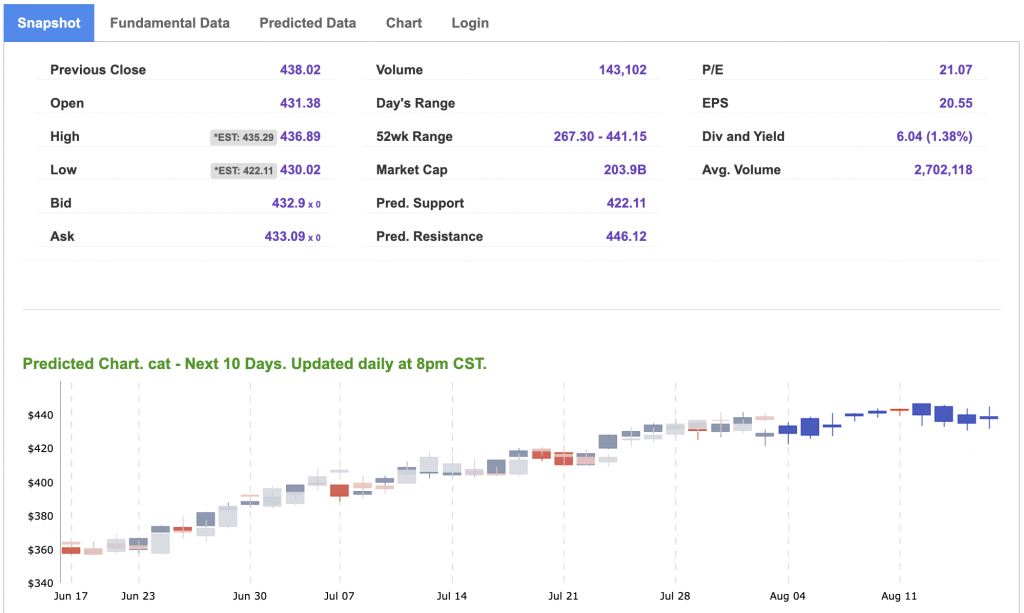
Our featured symbol for Tuesday is CAT. Caterpillar Inc. – CAT is showing a steady vector in our Stock Forecast Toolbox’s 10-day forecast.
The symbol is trading at $297.65 with a vector of +0.64% at the time of publication.
10-Day Prediction data is uploaded after the market close at 6 p.m., CST. Today’s data is based on market signals from the previous trading session.
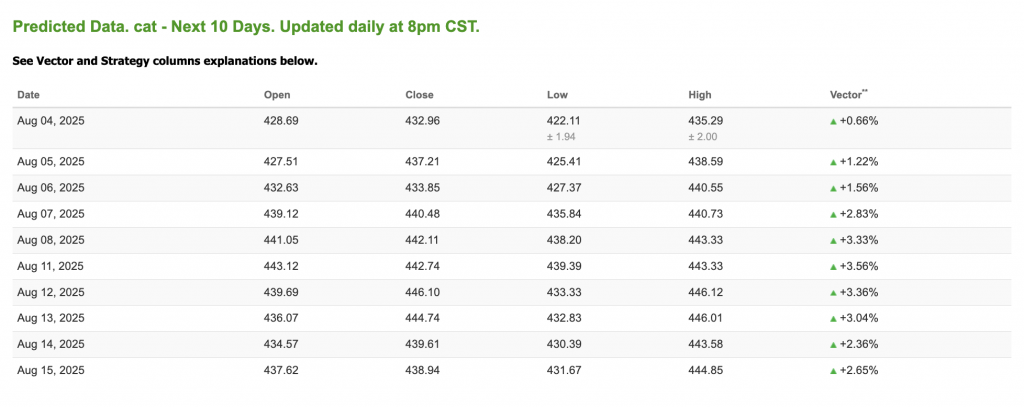
Note: The Vector column calculates the change of the Forecasted Average Price for the next trading session relative to the average of actual prices for the last trading session. The column shows the expected average price movement “Up or Down”, in percent. Trend traders should trade along the predicted direction of the Vector. The higher the value of the Vector the higher its momentum.
*Please note: At the time of publication, Vlad Karpel does have a position in the featured symbol, CAT. Our featured symbol is part of your free subscription service. It is not included in any paid Tradespoon subscription service. Vlad Karpel only trades his money in paid subscription services. If you are a paid subscriber, please review your Premium Member Picks, ActiveTrader, or MonthlyTrader recommendations. If you are interested in receiving Vlad’s picks, please click here.
West Texas Intermediate for Crude Oil delivery (CL.1) is priced at $66.60 per barrel, UP 2.23%, at the time of publication.
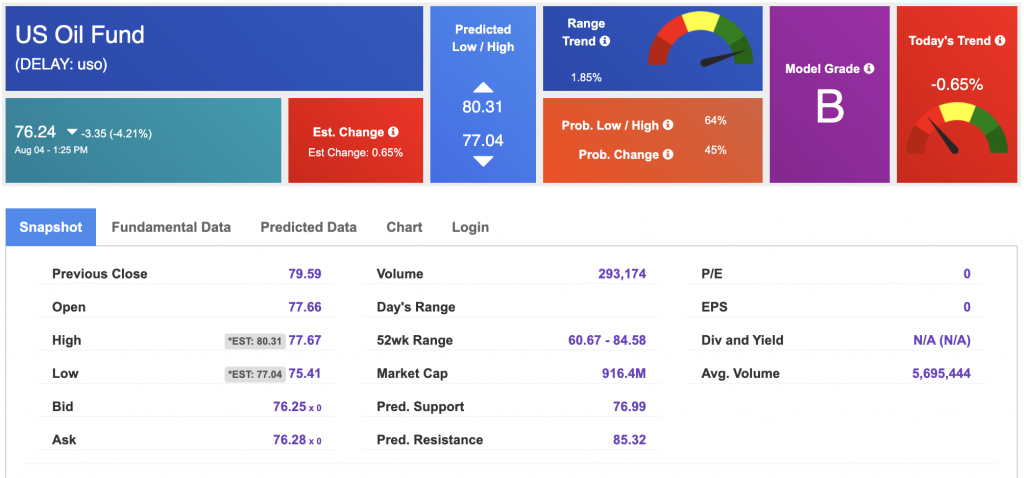
Looking at USO, a crude oil tracker, our 10-day prediction model shows mixed signals. The fund is trading at $76.24 at the time of publication. Prediction data is uploaded after the market close at 6 p.m., CST. Today’s data is based on market signals from the previous trading session.
The price for the Gold Continuous Contract (GC00) is DOWN 0.73% at $3,331.20 at the time of publication.
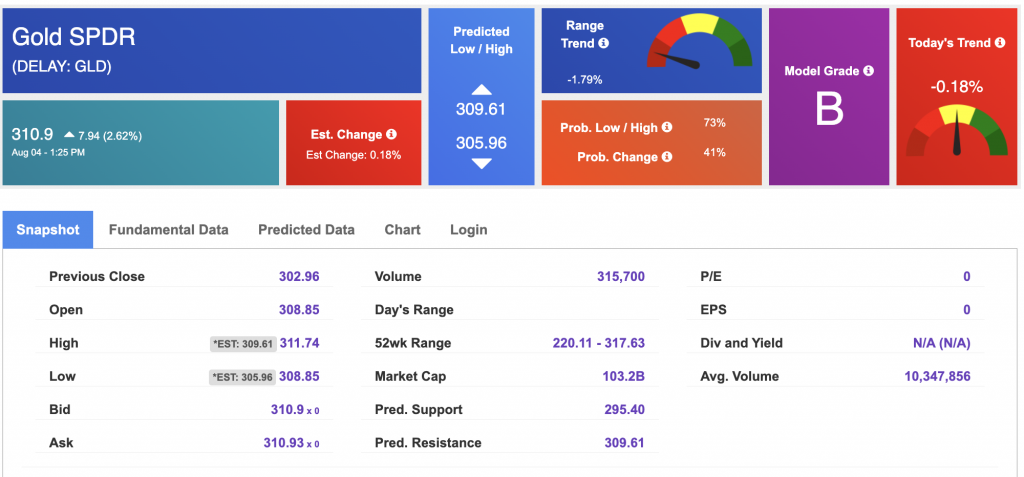
Using SPDR GOLD TRUST (GLD) as a tracker in our Stock Forecast Tool, the 10-day prediction window shows mixed signals. The gold proxy is trading at $310.9 at the time of publication. Vector signals show -0.18% for today. Prediction data is uploaded after the market close at 6 p.m., CST. Today’s data is based on market signals from the previous trading session.
The yield on the 10-year Treasury note is down at 4.208% at the time of publication.
The yield on the 30-year Treasury note is down at 4.798% at the time of publication.
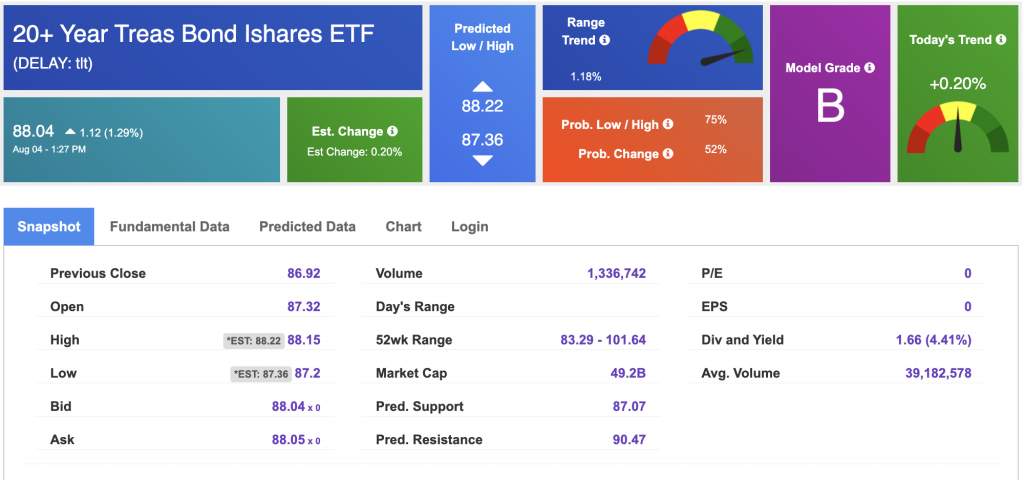
Using the iShares 20+ Year Treasury Bond ETF (TLT) as a proxy for bond prices in our Stock Forecast Tool, we see mixed signals in our 10-day prediction window. Prediction data is uploaded after the market close at 6 p.m., CST. Today’s data is based on market signals from the previous trading session.
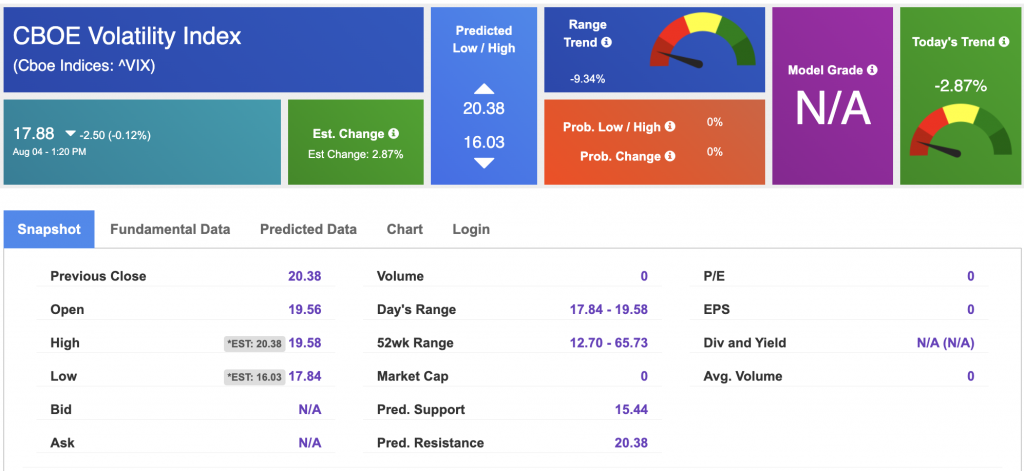
The CBOE Volatility Index (^VIX) is priced at $17.88 at the time of publication, and our 10-day prediction window shows mixed signals. Prediction data is uploaded after the market close at 6 p.m., CST. Today’s data is based on market signals from the previous trading session.
Please share this Tradespoon Market Commentary with your friends.
![]()

![]()
Comments Off on


Tradespoon Tools make finding winning trades in minute as easy as 1-2-3.
Our simple 3 step approach has resulted in an average return of almost 20% per trade!