 Special Offer: Try the 'Elite Trading Circle Membership' for ONLY $37!
CLICK HERE TO LEARN MORE
Special Offer: Try the 'Elite Trading Circle Membership' for ONLY $37!
CLICK HERE TO LEARN MORE
Stocks are pressing toward new highs, but beneath the surface, momentum is weakening, volatility is creeping higher, and interest rates remain a constraint—making this a market that demands discipline, not blind confidence.
The market enters February at an inflection point—buoyed by fresh economic data, yet still constrained by tightening financial conditions and fading momentum. While equities are pushing toward new highs, the underlying tape suggests a market that is stabilizing rather than accelerating.
Last week’s action set the tone. Stocks spent much of the period digesting a dense mix of earnings results, policy headlines, and macro signals. Early optimism gave way to selective conviction as investors became more discerning about what they were willing to pay for growth. By week’s end, major indices had pulled back modestly, volatility remained contained, and leadership continued to fragment—signs of recalibration, not breakdown.
Earnings then took center stage last week, and dispersion defined performance. Microsoft’s sharp selloff following softer cloud growth and margin guidance highlighted the market’s growing intolerance for ambiguity—especially in high-multiple software names. In contrast, Meta’s strong results and forward guidance were rewarded decisively, underscoring a key theme: investment spending is acceptable, but only when paired with visible returns.
Beyond Big Tech, results were broadly constructive but selectively rewarded. Industrials tied to long-cycle demand continued to reinforce confidence, while areas lacking margin visibility struggled to gain traction. Despite roughly 80% of companies beating estimates, tech’s weight amplified volatility and weighed on index-level momentum.
Overlaying earnings was a subtle but important shift in monetary expectations. Reports suggesting the Federal Reserve may pause rate cuts longer than previously anticipated—amid a resilient economy and firm inflation expectations—pushed Treasury yields higher and pressured long-duration growth stocks. The 10-year yield remained volatile, trading in a wide range between roughly 3.6% and 4.35%, reinforcing that rates are no longer a passive backdrop for equity valuations.
Meanwhile, broader policy uncertainty lingered. A partial government shutdown delayed key economic releases, and renewed fiscal rhetoric added to inflation concerns. Still, markets largely looked past the noise, prioritizing earnings quality and balance-sheet strength over headlines.
By the end of the week, the message was clear: capital was rotating, not fleeing. Energy, materials, and select cyclicals continued to show relative strength, while software and speculative growth names faced sustained pressure. Volatility eased, but conviction narrowed.
The first week of February opened on a more constructive note. Monday’s manufacturing data delivered something markets had been waiting for—confirmation that growth is re-emerging. The ISM Manufacturing PMI jumped back into expansion territory, snapping a prolonged contraction and immediately lifting equities. The S&P 500 moved toward a new closing high, with the Dow and Nasdaq following suit.
Importantly, the details supported the headline. New orders surged, pointing to improving demand ahead. At the same time, employment within manufacturing remained soft, suggesting growth without overheating—a combination markets tend to favor.
Yet not all assets participated. Metals, cryptocurrencies, and speculative exposures continued to unwind, extending a pullback that began after renewed focus on Fed leadership and policy direction. Gold, which had recently served as a hedge against uncertainty, sold off sharply as defensive positioning eased. This divergence reinforces a key takeaway: risk is being managed, not abandoned.
From a technical perspective, markets are at an important junction. The VIX is hovering near 18—elevated enough to reflect caution, but far from signaling stress. Major indices are trading near their 50-day moving averages, suggesting consolidation rather than trend exhaustion.
Momentum has clearly deteriorated, even as prices remain elevated. That divergence matters.
I remain in a market-neutral camp. The long-term trend remains intact, but near-term risks are rising.
The primary risk is that interest rates stay higher for longer just as unemployment indicators begin to tick up. That combination tends to pressure multiples and compress forward returns. While earnings growth expectations remain healthy, the market no longer has the luxury of ignoring rates or inflation dynamics.
From a structural standpoint, I see upside potential toward the $700–$720 range in SPY over the coming months if earnings confirmation continues and rates stabilize. On the downside, $650–$660 remains key support, and pullbacks into that zone would not surprise me given current conditions.
This is not a market that rewards broad exposure or narrative-driven trades. Leadership is fragmenting. Selectivity matters. Discipline matters more.
The market is still offering opportunities—but they are narrower, more tactical, and increasingly tied to real demand, cash flow visibility, and balance-sheet durability. In this environment, staying adaptable and grounded is far more valuable than chasing momentum or predicting headlines.
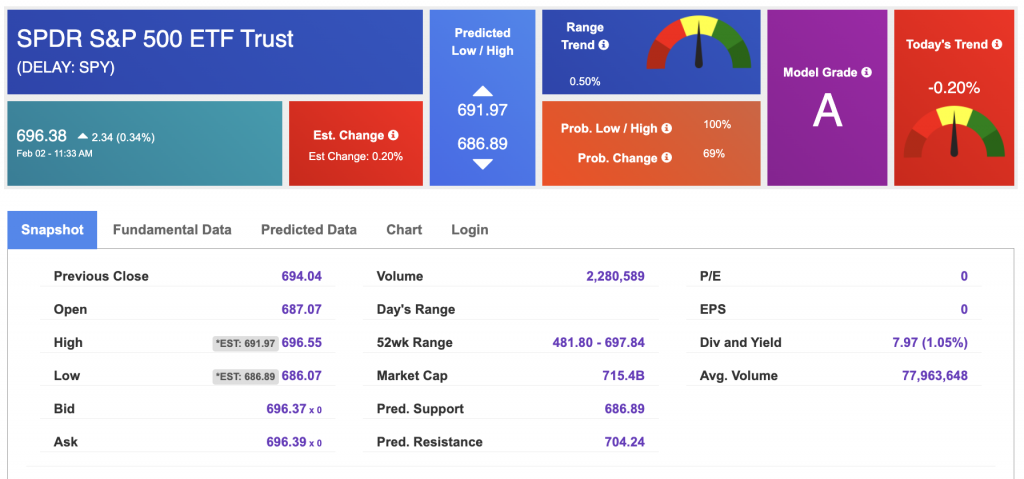
Using the “SPY” symbol to analyze the S&P 500, our 10-day prediction window shows a near-term positive outlook. Prediction data is uploaded after the market closes at 6 p.m. CST. Today’s data is based on market signals from the previous trading session.
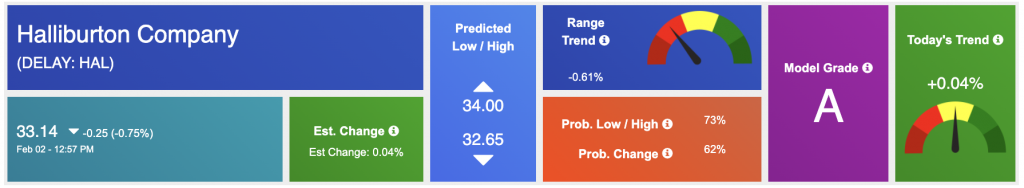
Our featured symbol for Tuesday is HAL. Haliburton (HAL) is showing a steady vector in our Stock Forecast Toolbox’s 10-day forecast.
The symbol is trading at $33.14 with a vector of +0.04% at the time of publication.
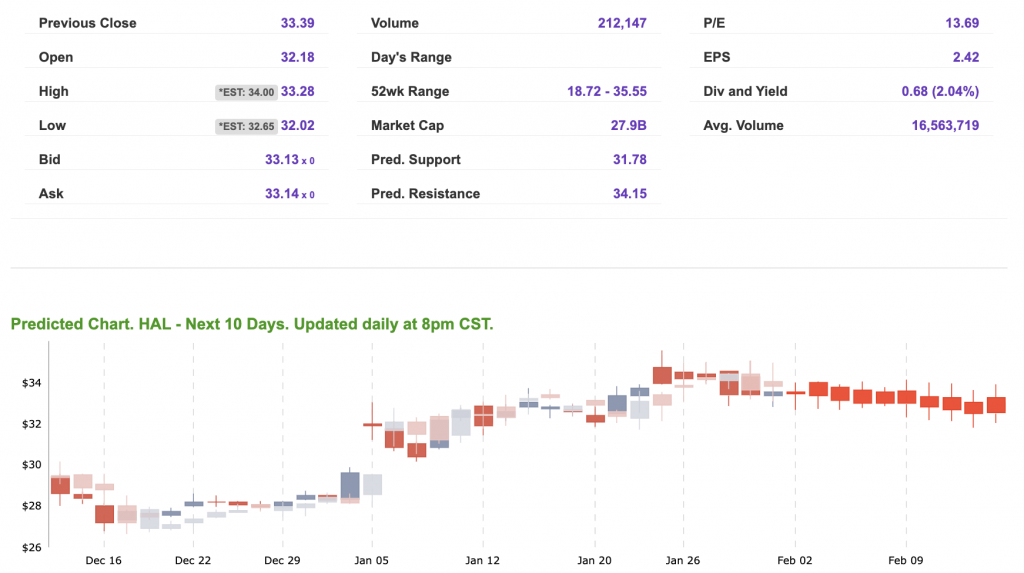
10-Day Prediction data is uploaded after the market close at 6 p.m., CST. Today’s data is based on market signals from the previous trading session.
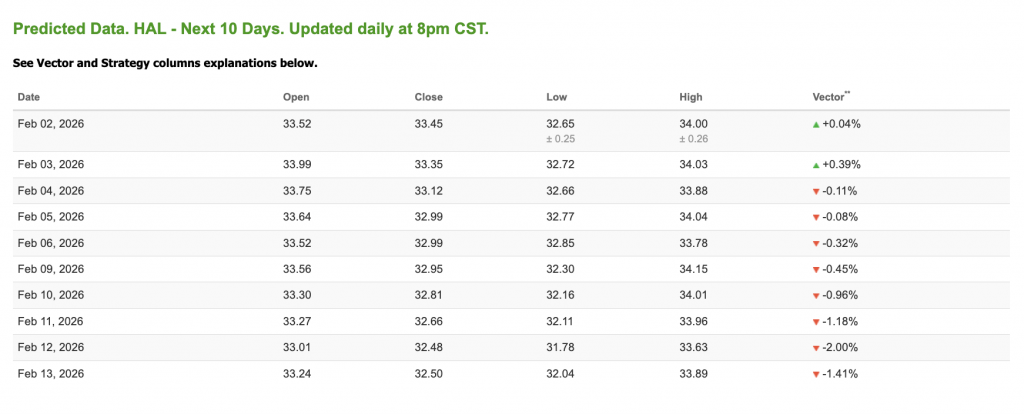
Note: The Vector column calculates the change of the Forecasted Average Price for the next trading session relative to the average of actual prices for the last trading session. The column shows the expected average price movement “Up or Down”, in percent. Trend traders should trade along the predicted direction of the Vector. The higher the value of the Vector the higher its momentum.
*Please note: At the time of publication, Vlad Karpel does have a position in the featured symbol, HAL. Our featured symbol is part of your free subscription service. It is not included in any paid Tradespoon subscription service. Vlad Karpel only trades his money in paid subscription services. If you are a paid subscriber, please review your Premium Member Picks, ActiveTrader, or MonthlyTrader recommendations. If you are interested in receiving Vlad’s picks, please click here.
West Texas Intermediate for Crude Oil delivery (CL.1) is priced at $61.74 per barrel, down 5.32%, at the time of publication.
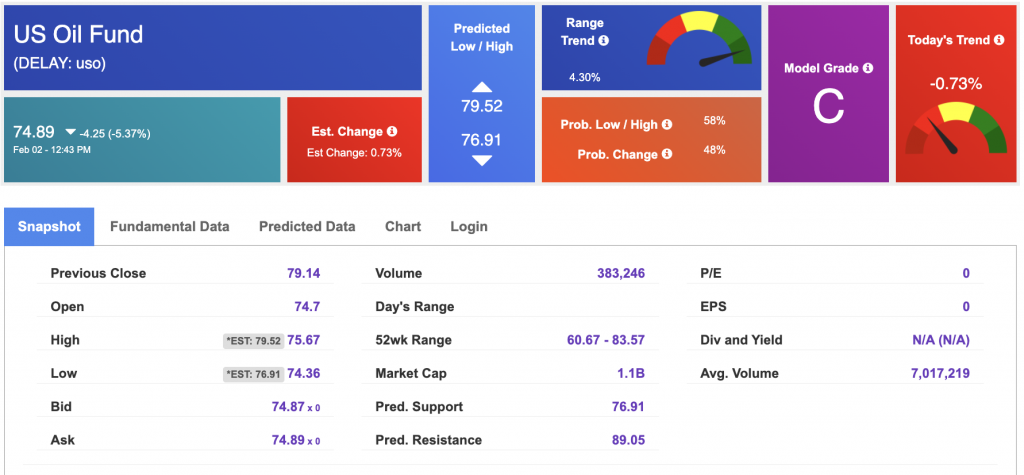
Looking at USO, a crude oil tracker, our 10-day prediction model shows mixed signals. The fund is trading at $74.89 at the time of publication. Prediction data is uploaded after the market close at 6 p.m., CST. Today’s data is based on market signals from the previous trading session.
The price for the Gold Continuous Contract (GC00) is down 1.01% at $4,688.50 at the time of publication.
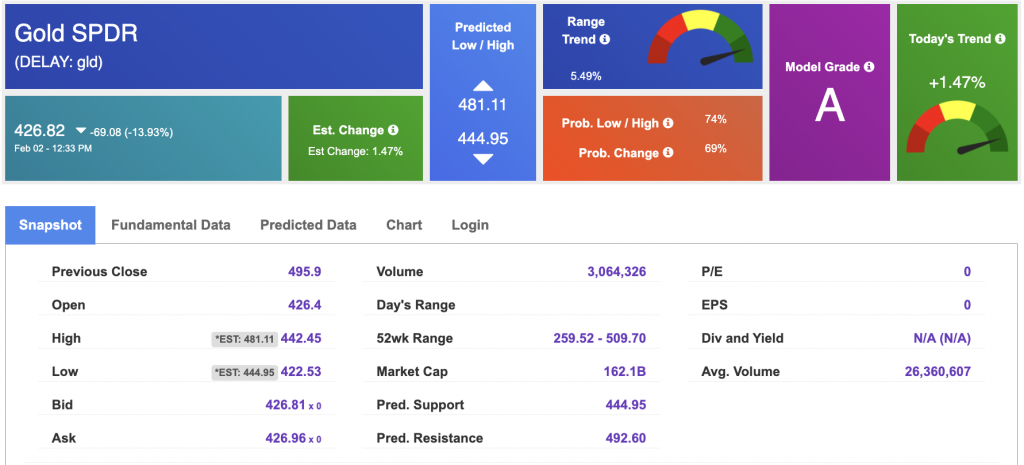
Using SPDR GOLD TRUST (GLD) as a tracker in our Stock Forecast Tool, the 10-day prediction window shows mixed signals. The gold proxy is trading at $426.82 at the time of publication. Vector signals show +1.47% for today. Prediction data is uploaded after the market close at 6 p.m., CST. Today’s data is based on market signals from the previous trading session.
The yield on the 10-year Treasury note is up at 4.274% at the time of publication.
The yield on the 30-year Treasury note is up at 4.902% at the time of publication.
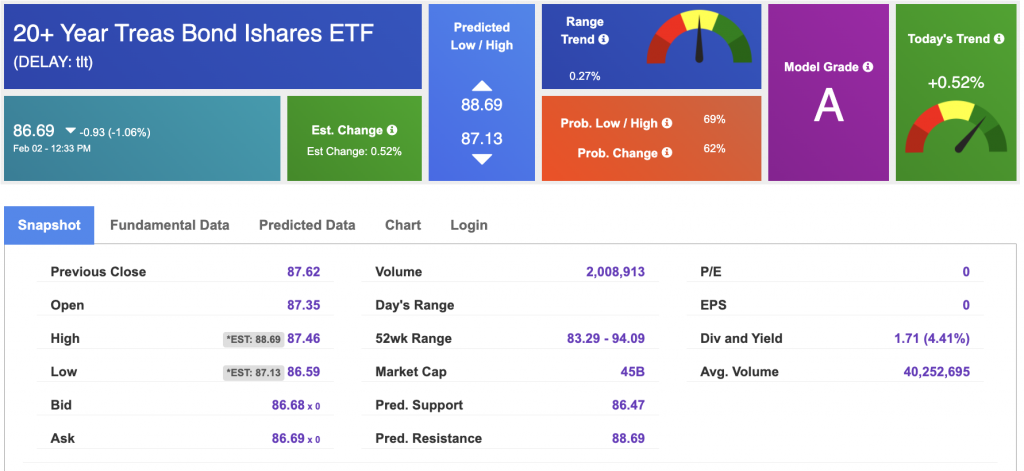
Using the iShares 20+ Year Treasury Bond ETF (TLT) as a proxy for bond prices in our Stock Forecast Tool, we see mixed signals in our 10-day prediction window. Prediction data is uploaded after the market close at 6 p.m., CST. Today’s data is based on market signals from the previous trading session.
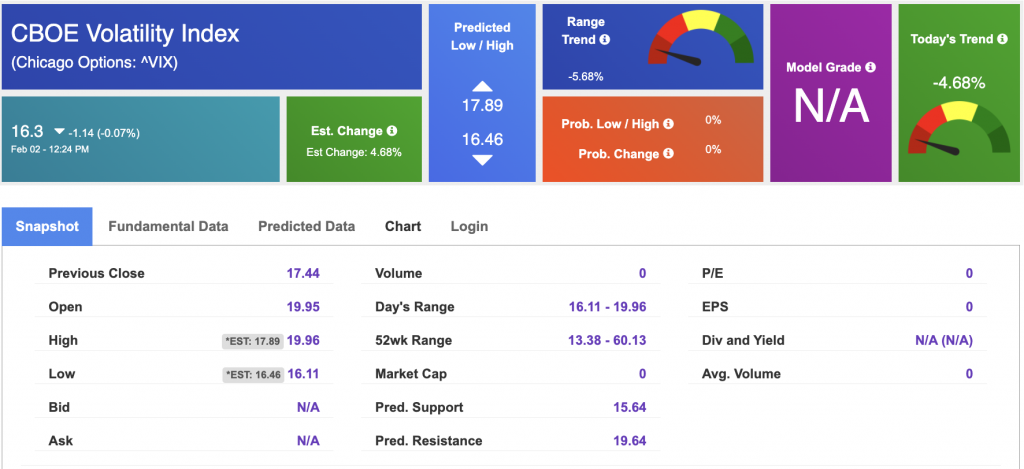
The CBOE Volatility Index (^VIX) is priced at $15.95 at the time of publication, and our 10-day prediction window shows mixed signals. Prediction data is uploaded after the market close at 6 p.m., CST. Today’s data is based on market signals from the previous trading session.
Please share this Tradespoon Market Commentary with your friends.
![]()

![]()
Comments Off on


Tradespoon Tools make finding winning trades in minute as easy as 1-2-3.
Our simple 3 step approach has resulted in an average return of almost 20% per trade!

