 Special Offer: Try the 'WeeklyTrader Membership' for ONLY $37!
CLICK HERE TO LEARN MORE
Special Offer: Try the 'WeeklyTrader Membership' for ONLY $37!
CLICK HERE TO LEARN MORE
Markets spent last week teetering between cautious optimism and lingering uncertainty, with the S&P 500 (SPY) oscillating around the $617 mark as investors grappled with fresh tariff threats, mixed economic readings, and the opening salvo of Q2 earnings. Despite relatively subdued volatility—VIX around 15—and a buoyant tech sector led by Nvidia’s continued ascent toward a $4 trillion market cap, this rally remains fragile. My stance remains market neutral: I expect SPY to tread water in the near term, capped by resistance in the $630–$640 area and finding support near $580–$590.
The week kicked off with a jolt on Monday, July 7, when President Trump ramped up global trade rhetoric, rattling markets with threats of steep new tariffs, including a proposed 50% duty on copper and 35% levy on Canadian goods. What began as offhand comments quickly crystallized into formal letters to key trading partners, sending the Dow plummeting over 600 points intraday and dragging every one of the S&P 500’s 11 sectors lower, led by consumer discretionary, energy, and technology.
By midweek, sentiment found a foothold. On Wednesday, July 9, the release of the Federal Reserve’s June meeting minutes hinted that rate cuts could arrive in 2025—despite the Fed’s decision to hold rates at 4.25–4.50%—spurring a modest rebound in risk assets. A stronger-than-expected jobs report (147,000 positions added versus 110,000 forecast) stood in contrast to softer ISM manufacturing and services readings, sending the odds of a July rate cut down to about 55%, yet underlining the Fed’s dovish lean for the long haul. Treasury yields eased, with the 10 year dipping toward 4.35%, supporting rate-sensitive sectors.
Thursday’s momentum carried into Q2 earnings season, highlighted by Delta Air Lines exceeding projections and reaffirming its full-year outlook. Airline stocks rallied—AAL up 12%, United 14%—and the broader industrial complex picked up steam. Energy names like Halliburton and Baker Hughes also caught a bid, reflecting selective buying in beaten-down pockets of the market.
Yet Friday’s reopening reminded that this market can turn on a dime: renewed tariff threats against Canada sent indices lower, with the Dow retreating nearly 300 points and the S&P 500 slipping 0.2%, even as Nvidia’s 1.3% gain rescued the Nasdaq back to flat. Bitcoin punctuated a speculative undercurrent by vaulting past $118,000—its highest ever—on hopes for a September Fed rate cut, burgeoning ETF inflows, and a friendlier regulatory backdrop.
Fast?forward to today, Monday, July 14, and stocks tread water, with the S&P 500 and Dow hovering near breakeven and the Nasdaq up about 0.4%, charting a gradual upward trend. Much of today’s drift reflects investors bracing for a packed agenda: tomorrow’s kick off of bank earnings from J.P. Morgan, Wells Fargo, and Citigroup; midweek inflation data including CPI on Tuesday and PPI plus the Fed’s Beige Book on Wednesday; Thursday’s Retail Sales and Import Prices; and a procession of Fed speakers poised to sway policy expectations.
Meanwhile, the bond market is stirring. The 10-year Treasury yield has climbed from 4.412% on Friday to roughly 4.444% this morning, while the 30-year approaches its 5% ceiling at about 4.973% levels that, once breached, could attract fresh buyer interest and further pressure equities. On the geopolitical front, President Trump announced plans to impose 100% secondary tariffs on any nation trading with Russia if a Ukraine peace deal isn’t reached within 50 days—a proposal that, while less draconian than the bipartisan Senate bill seeking 500% duties on Russian imports, nonetheless injects fresh uncertainty into global trade flows.
Crypto markets picked up where they left off, with Bitcoin briefly topping $122,800 before settling near $119,800—a remarkable leap from the sub-$70,000 levels of late 2024 and a testament to Washington’s increasingly constructive posture toward digital assets as several crypto?friendly bills advance through Congress.
Looking ahead, earnings from marquee names such as Bank of America, Goldman Sachs, Morgan Stanley, Johnson & Johnson, Netflix, GE Aerospace, PepsiCo, American Express, Charles Schwab, and 3M will help set the tone for the rest of the earnings season. With analyst forecasts pointing to just 4.8% year-over-year S&P 500 earnings growth—the weakest since late 2023—expectations remain muted. In this environment, selective stock picking and disciplined risk management will be paramount.
In sum, a potent mix of tariff skirmishes, central-bank maneuvering, rising yields, and pivotal corporate earnings will define market direction over the coming days. Stay nimble, focus on quality names supported by strong fundamentals—or, when warranted, hedge tactically—and let data, not emotion, drive your next move.
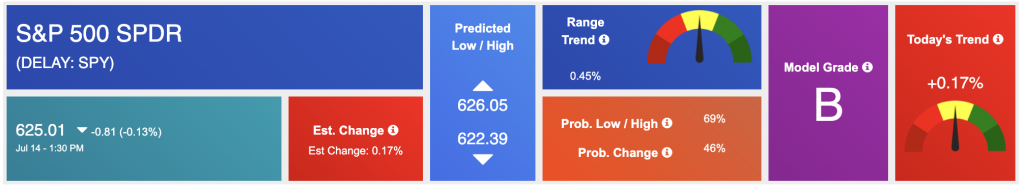
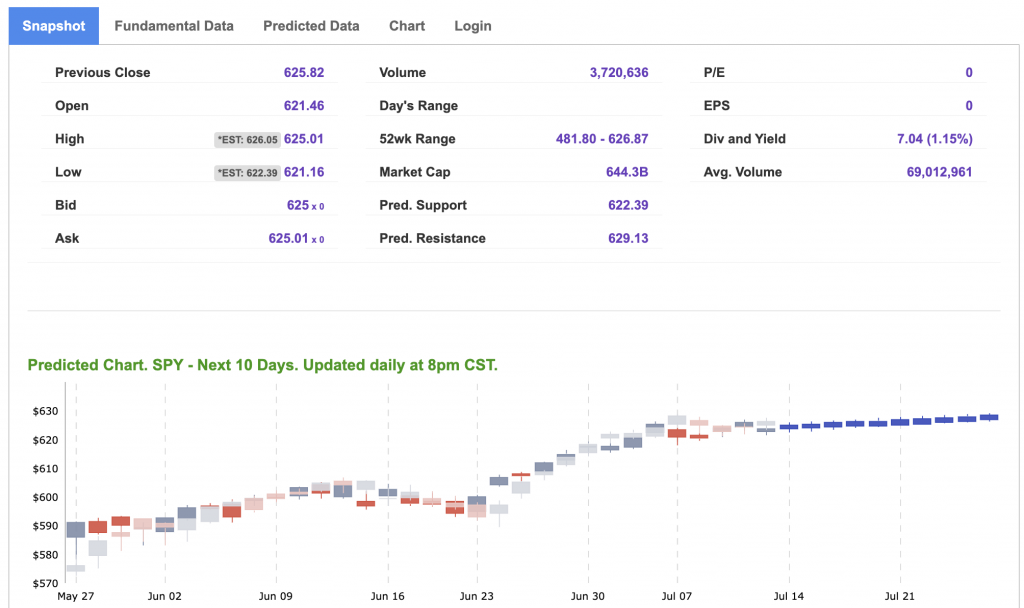
Using the “SPY” symbol to analyze the S&P 500, our 10-day prediction window shows a near-term positive outlook. Prediction data is uploaded after the market closes at 6 p.m. CST. Today’s data is based on market signals from the previous trading session.
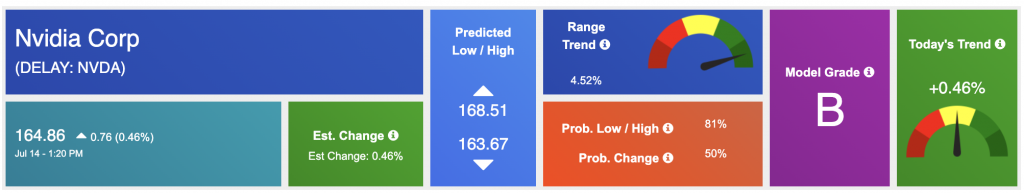
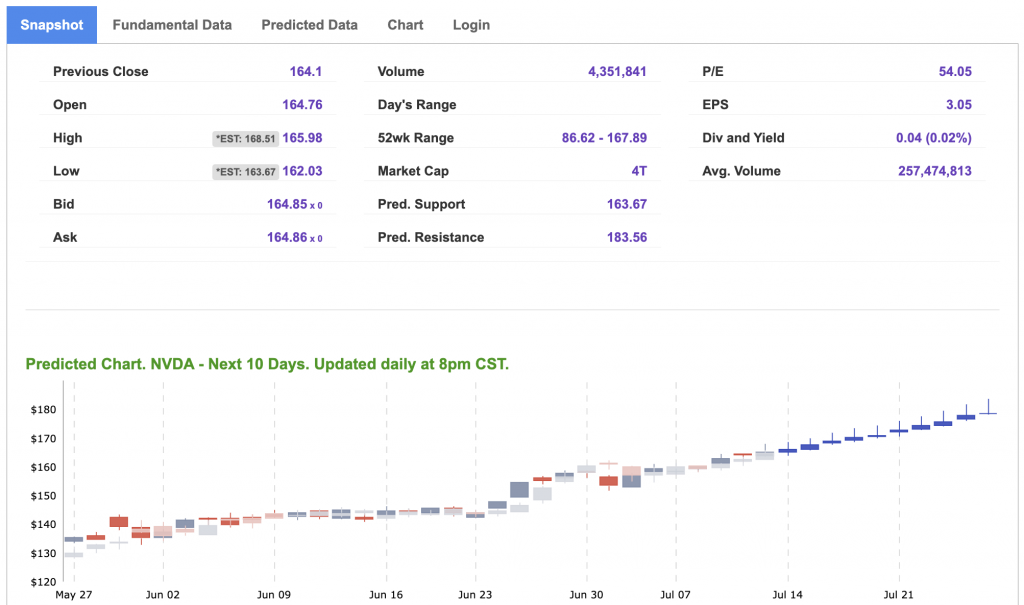
Our featured symbol for Tuesday is NVDA. Nvidia Corp. – NVDA is showing a steady vector in our Stock Forecast Toolbox’s 10-day forecast.
The symbol is trading at $164.86 with a vector of +0.46% at the time of publication.
10-Day Prediction data is uploaded after the market close at 6 p.m., CST. Today’s data is based on market signals from the previous trading session.
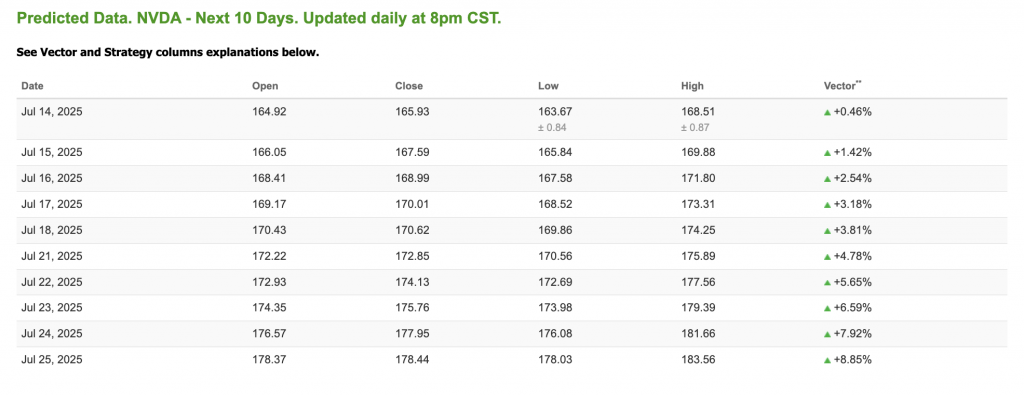
Note: The Vector column calculates the change of the Forecasted Average Price for the next trading session relative to the average of actual prices for the last trading session. The column shows the expected average price movement “Up or Down”, in percent. Trend traders should trade along the predicted direction of the Vector. The higher the value of the Vector the higher its momentum.
*Please note: At the time of publication, Vlad Karpel does have a position in the featured symbol, NVDA. Our featured symbol is part of your free subscription service. It is not included in any paid Tradespoon subscription service. Vlad Karpel only trades his money in paid subscription services. If you are a paid subscriber, please review your Premium Member Picks, ActiveTrader, or MonthlyTrader recommendations. If you are interested in receiving Vlad’s picks, please click here.
West Texas Intermediate for Crude Oil delivery (CL.1) is priced at $67.00 per barrel, down 2.13%, at the time of publication.
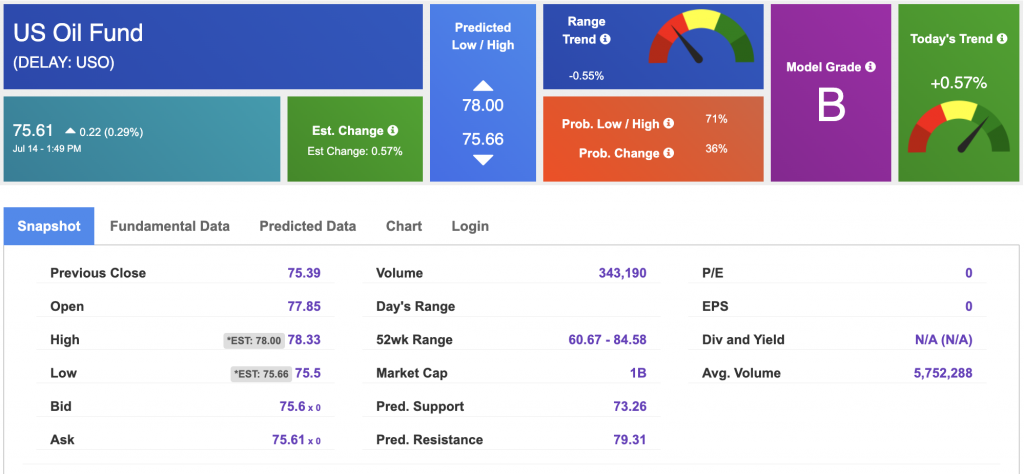
Looking at USO, a crude oil tracker, our 10-day prediction model shows mixed signals. The fund is trading at $73.17 at the time of publication. Prediction data is uploaded after the market close at 6 p.m., CST. Today’s data is based on market signals from the previous trading session.
The price for the Gold Continuous Contract (GC00) is down 0.14% at $3,359.10 at the time of publication.
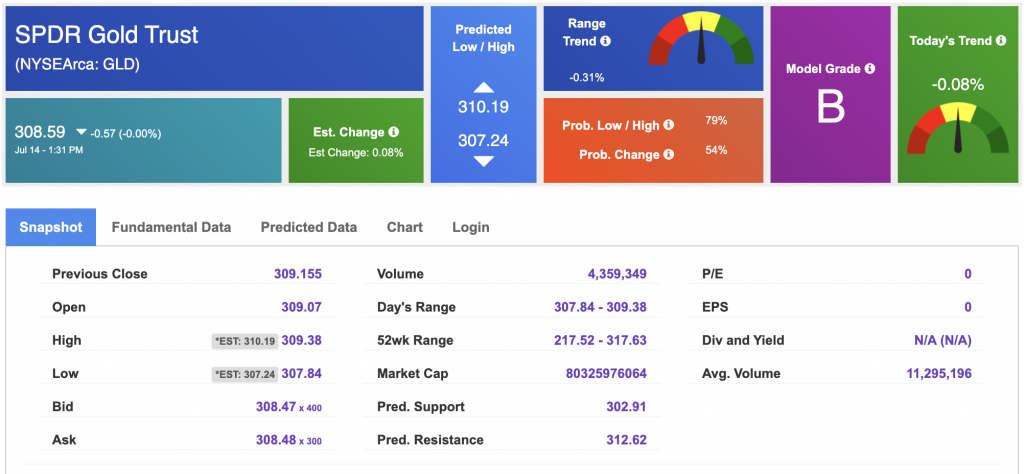
Using SPDR GOLD TRUST (GLD) as a tracker in our Stock Forecast Tool, the 10-day prediction window shows mixed signals. The gold proxy is trading at $307.47 at the time of publication. Vector signals show -0.06% for today. Prediction data is uploaded after the market close at 6 p.m., CST. Today’s data is based on market signals from the previous trading session.
The yield on the 10-year Treasury note is up at 4.432% at the time of publication.
The yield on the 30-year Treasury note is up at 4.974% at the time of publication.
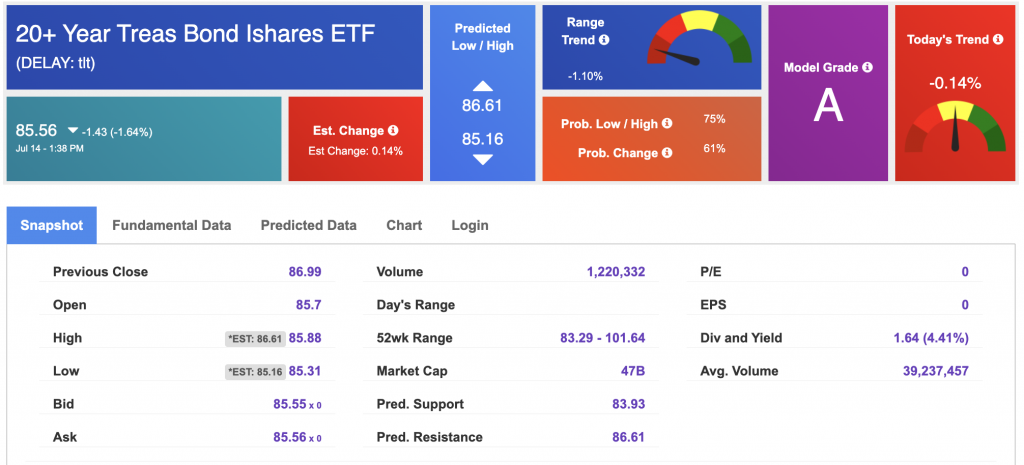
Using the iShares 20+ Year Treasury Bond ETF (TLT) as a proxy for bond prices in our Stock Forecast Tool, we see mixed signals in our 10-day prediction window. Prediction data is uploaded after the market close at 6 p.m., CST. Today’s data is based on market signals from the previous trading session.
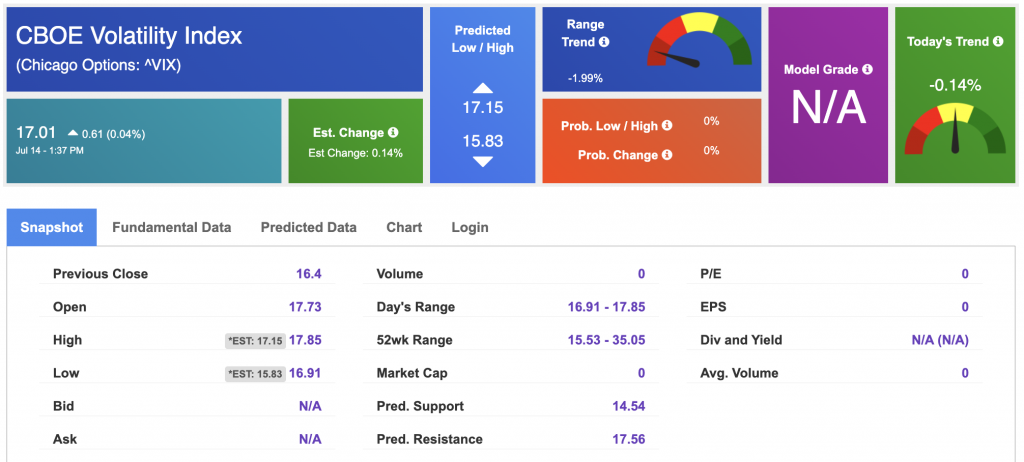
The CBOE Volatility Index (^VIX) is priced at $17.01 at the time of publication, and our 10-day prediction window shows mixed signals. Prediction data is uploaded after the market close at 6 p.m., CST. Today’s data is based on market signals from the previous trading session.
Please share this Tradespoon Market Commentary with your friends.
![]()

![]()
Comments Off on


Tradespoon Tools make finding winning trades in minute as easy as 1-2-3.
Our simple 3 step approach has resulted in an average return of almost 20% per trade!

