 Special Offer: Try the 'Vlad's Portfolio Membership' for ONLY $37!
CLICK HERE TO LEARN MORE
Special Offer: Try the 'Vlad's Portfolio Membership' for ONLY $37!
CLICK HERE TO LEARN MORE
Wall Street entered the final trading session of Q2 on a high, with all three major indexes pushing toward or hitting new record levels. The S&P 500 added another 0.3% on Monday, bringing its second-quarter gain to over 10%—its best performance since Q4 2023. The Nasdaq soared 17.5% for the quarter, its strongest since the post-pandemic tech boom of mid-2020, while the Dow rose 4.7%, notching its best quarter in a year.
Yet beneath the headline highs, the market’s foundation remains precarious. As we noted last week, this latest rally has been powered less by fundamental conviction and more by hope: hope for stable geopolitics, a soft-landing economy, and a patient Fed. Fragile optimism continues to drive indexes upward, even as economic data flashes warning signs and Fed officials send mixed messages.
LOOKING BACK: A Week of Highs and Headwinds
Last week’s rally was notable not only for the gains but for the environment in which they occurred. Monday opened with geopolitical anxiety at the forefront: reports of U.S. and Israeli strikes on Iranian assets sent oil prices surging above $77 per barrel, while the VIX spiked alongside stocks—a rare pairing that underscored investor unease.
By midweek, however, sentiment reversed after President Trump announced a brokered ceasefire between Israel and Iran, helping calm oil markets and boosting risk appetite. The tech sector—especially AI leaders like Nvidia, Palantir, and Super Micro Computer—resumed its dominance, carrying the S&P 500 and Nasdaq to new intraday highs.
Even so, economic data threw cold water on the narrative. U.S. Q1 GDP was revised lower to -0.5%, May retail sales plunged 0.9%, and personal income and spending both declined. Labor data showed rising continuing jobless claims, while the Core PCE Index—the Fed’s preferred inflation gauge—came in hotter than expected at 2.7% year-over-year. Disinflation, once the tailwind for a dovish pivot, has seemingly stalled.
Fed Chair Jerome Powell’s testimony to Congress offered little clarity. He acknowledged elevated inflation but avoided specifics on timing for rate cuts. Meanwhile, Fed Governor Christopher Waller floated the idea of a cut as early as July, adding to the uncertainty and fueling speculation that internal disagreement is growing within the central bank.
Despite these red flags, markets pressed on, lifted late in the week by optimism around U.S.-China trade. Canada’s reversal of its digital sales tax further boosted sentiment, raising hopes for broader digital trade deals ahead of a key July 9 tariff deadline. The S&P 500 closed Friday at 6,144.15, a new record, and futures pointed higher on Monday.
STOCK SPOTLIGHT: Winners, Laggards, and Market Signals
Oracle (ORCL) was among Monday’s biggest gainers, rising 6% after revealing multiple cloud services deals, including one expected to generate over $30 billion annually starting in FY28. It’s a major long-term signal of confidence in enterprise demand and AI infrastructure growth.
Nvidia (NVDA) dipped slightly after a 1.8% rally on Friday that brought its market cap to a record $3.8 trillion, cementing its place as the most valuable company in the U.S. A $4 trillion valuation could be next, but the stock’s meteoric rise has left some investors wary of its sustainability.
Tesla (TSLA) continues to face headwinds, falling 1% Monday after news that a Senate bill could kill EV tax credits by September, sooner than previously proposed. Elon Musk criticized the bill as it narrowly passed a weekend vote, adding political pressure to an already struggling sector.
Big Banks such as JPMorgan, Goldman Sachs, and Wells Fargo all saw gains last week between 1.5% and 2.3% after passing the Fed’s annual stress tests. These results pave the way for dividend hikes and buybacks, signaling balance sheet strength even as recessionary risks grow.
MACRO OUTLOOK: A Market at a Crossroads
Despite the record highs, investor sentiment remains uneasy. Last week’s data confirmed that U.S. consumers are slowing down, inflation remains sticky, and the labor market is showing cracks. Treasury yields continued to fall on Monday, with the 10-year note dipping to 4.35%, as traders bet on a dovish shift in Fed policy, even as the Fed itself offers no clear timeline.
At the same time, geopolitical risk remains a wildcard. While the ceasefire between Israel and Iran holds for now, the broader conflict remains unresolved. And the expiration of U.S.-China tariff pauses in July and August could reignite inflationary fears if no new deals are struck.
THE WEEK AHEAD: Earnings Season Approaches, and Volatility Looms
This week will see earnings reports from Constellation Brands, MSC Industrial Direct, Greenbrier Cos., and UniFirst, offering early looks at both industrial health and consumer sentiment. With Q2 earnings season just around the corner, investors will be watching closely for any signs that profit growth is decelerating.
Meanwhile, attention will stay locked on inflation and the Fed. If July’s CPI or PCE prints disappoint, or if internal Fed disagreements widen, markets may struggle to hold their gains. SPY could still stretch toward the 600–620 range, but without a stronger economic footing or clear policy direction, a pullback to 580—or lower—is entirely possible.
Yes, the second quarter of 2025 will go down as one of the best in years. But the real story is what lies beneath the surface: consumer fatigue, labor strain, stubborn inflation, and unresolved global tensions. The breakout is real—but so are the risks.
For now, we remain market-neutral. The trend is higher, but conviction remains thin. This is a time for selectivity, risk management, and a willingness to adapt as the facts change. Whether Q3 continues the breakout—or exposes its flaws—will depend not on the headlines, but on how resilient the market proves beneath them.
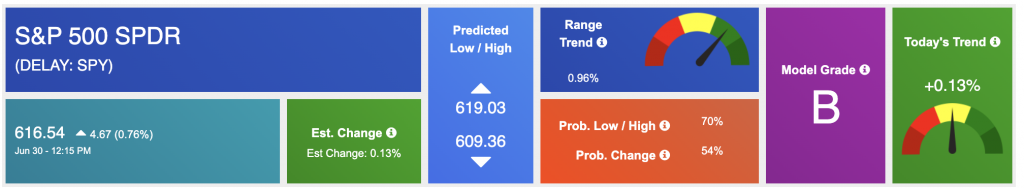
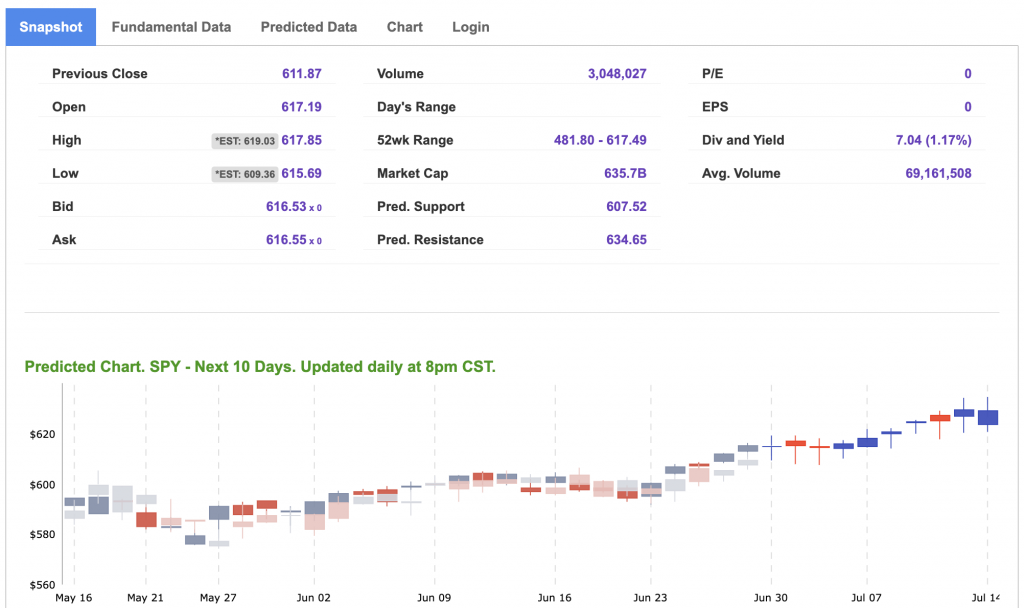
Using the “SPY” symbol to analyze the S&P 500, our 10-day prediction window shows a near-term positive outlook. Prediction data is uploaded after the market closes at 6 p.m. CST. Today’s data is based on market signals from the previous trading session.
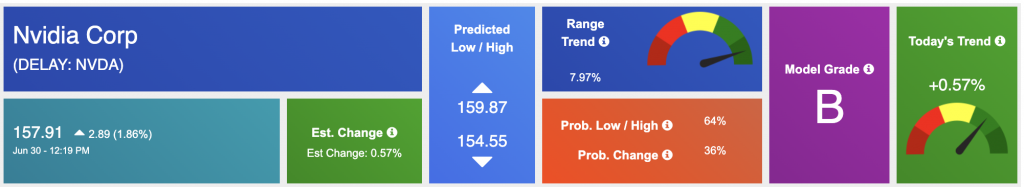
Our featured symbol for Tuesday is NVDA. NVDA Corp. – NVDA is showing a steady vector in our Stock Forecast Toolbox’s 10-day forecast.
The symbol is trading at $157.91 with a vector of +0.57% at the time of publication.
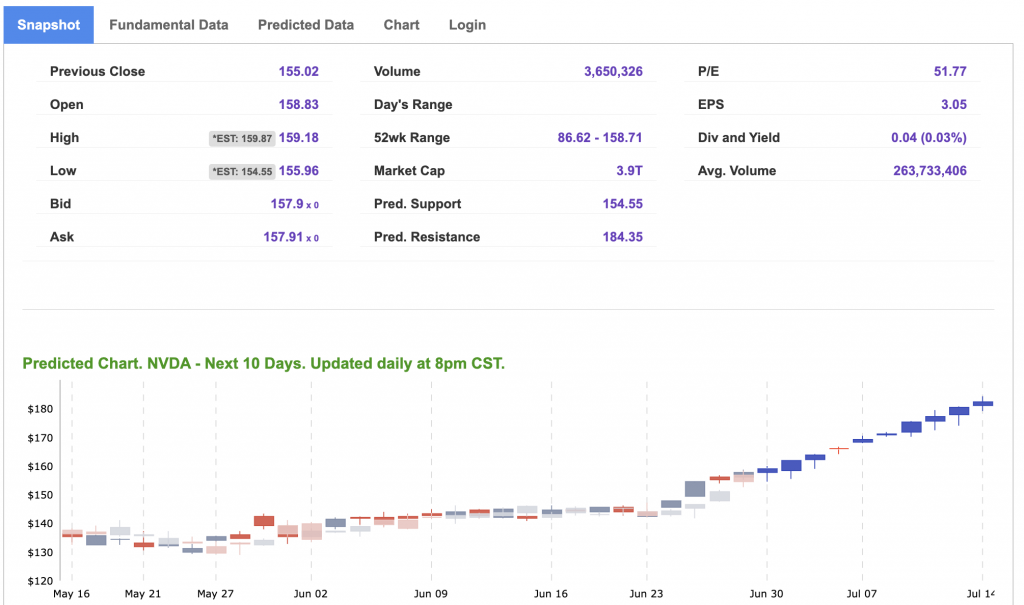
10-Day Prediction data is uploaded after the market close at 6 p.m., CST. Today’s data is based on market signals from the previous trading session.
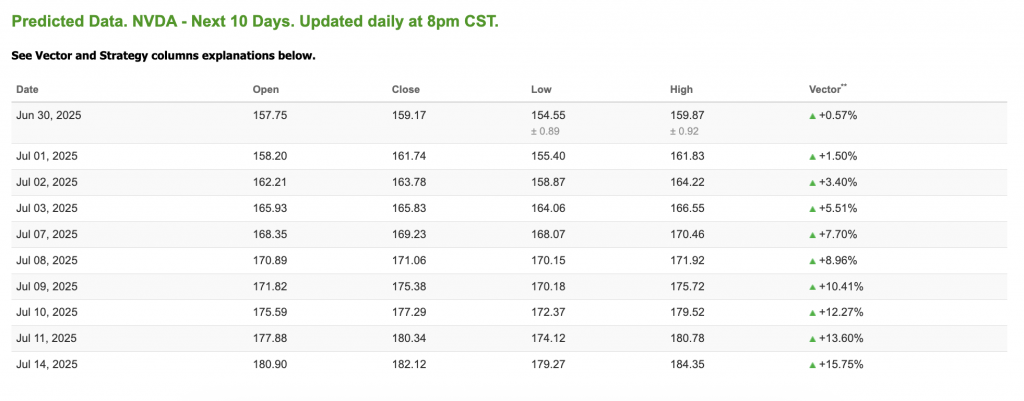
Note: The Vector column calculates the change of the Forecasted Average Price for the next trading session relative to the average of actual prices for the last trading session. The column shows the expected average price movement “Up or Down”, in percent. Trend traders should trade along the predicted direction of the Vector. The higher the value of the Vector the higher its momentum.
*Please note: At the time of publication, Vlad Karpel does have a position in the featured symbol, NVDA. Our featured symbol is part of your free subscription service. It is not included in any paid Tradespoon subscription service. Vlad Karpel only trades his money in paid subscription services. If you are a paid subscriber, please review your Premium Member Picks, ActiveTrader, or MonthlyTrader recommendations. If you are interested in receiving Vlad’s picks, please click here.
West Texas Intermediate for Crude Oil delivery (CL.1) is priced at $65.01 per barrel, down 0.78%, at the time of publication.
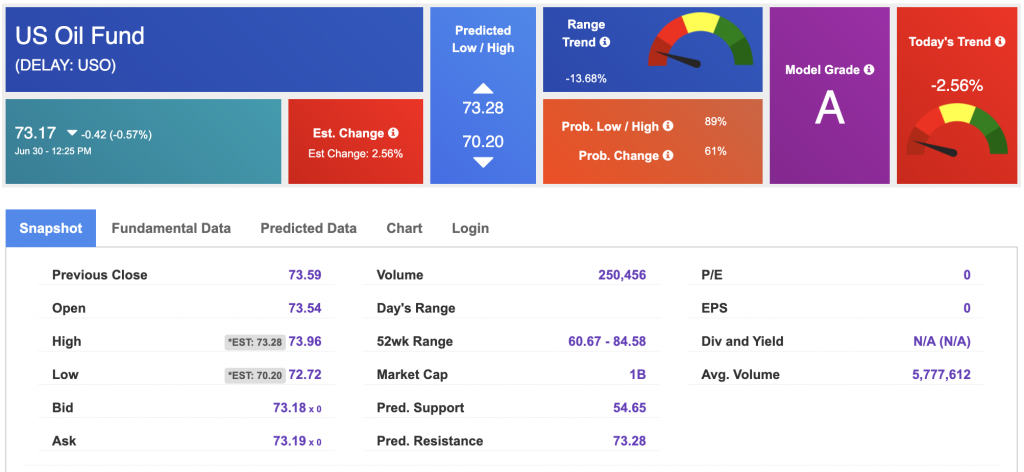
Looking at USO, a crude oil tracker, our 10-day prediction model shows mixed signals. The fund is trading at $73.17 at the time of publication. Prediction data is uploaded after the market close at 6 p.m., CST. Today’s data is based on market signals from the previous trading session.
The price for the Gold Continuous Contract (GC00) is up 0.66% at $3,309.50 at the time of publication.
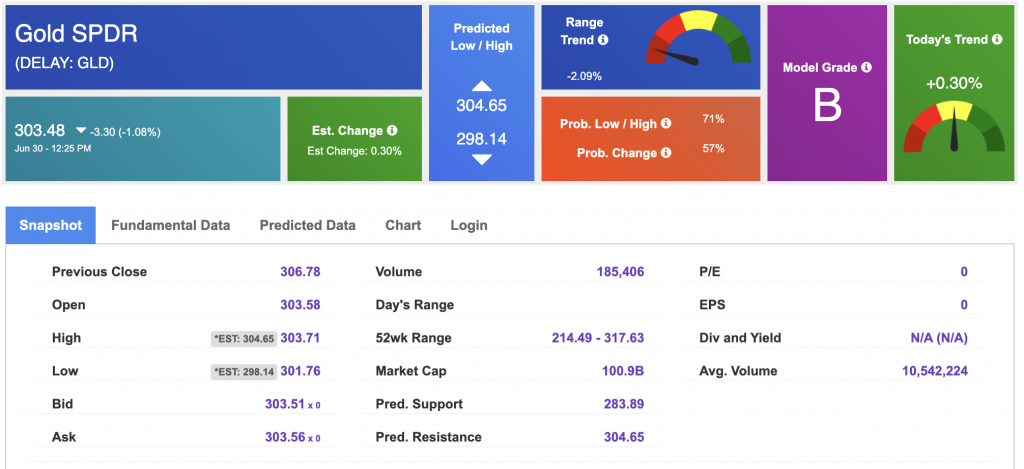
Using SPDR GOLD TRUST (GLD) as a tracker in our Stock Forecast Tool, the 10-day prediction window shows mixed signals. The gold proxy is trading at $303.48 at the time of publication. Vector signals show +0.30% for today. Prediction data is uploaded after the market close at 6 p.m., CST. Today’s data is based on market signals from the previous trading session.
The yield on the 10-year Treasury note is down at 4.243% at the time of publication.
The yield on the 30-year Treasury note is down at 4.790% at the time of publication.
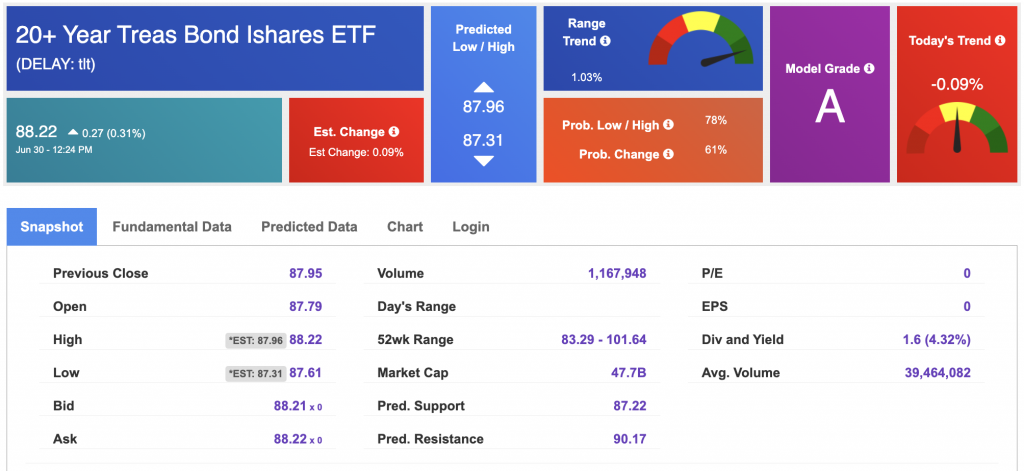
Using the iShares 20+ Year Treasury Bond ETF (TLT) as a proxy for bond prices in our Stock Forecast Tool, we see mixed signals in our 10-day prediction window. Prediction data is uploaded after the market close at 6 p.m., CST. Today’s data is based on market signals from the previous trading session.
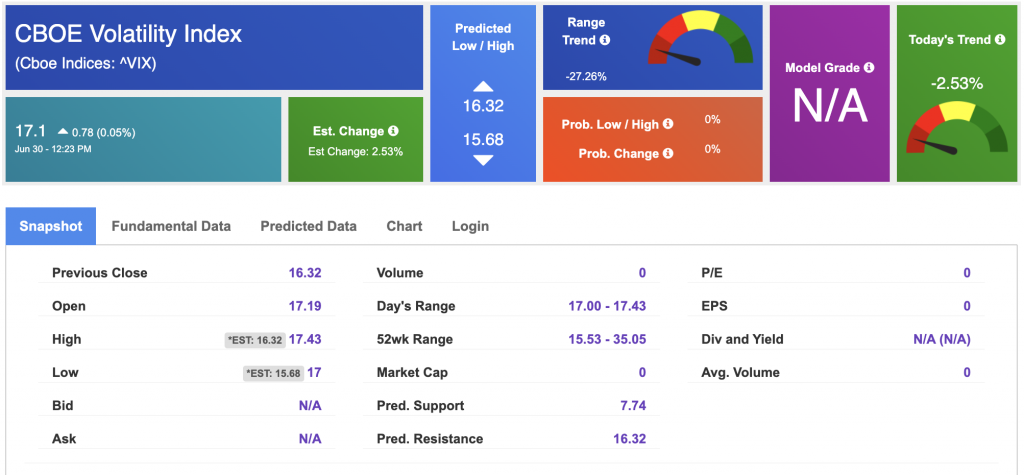
The CBOE Volatility Index (^VIX) is priced at $17.1 at the time of publication, and our 10-day prediction window shows mixed signals. Prediction data is uploaded after the market close at 6 p.m., CST. Today’s data is based on market signals from the previous trading session.
Please share this Tradespoon Market Commentary with your friends.
![]()

![]()
Comments Off on


Tradespoon Tools make finding winning trades in minute as easy as 1-2-3.
Our simple 3 step approach has resulted in an average return of almost 20% per trade!

