 Special Offer: Try the 'Picks Membership' for ONLY $37!
CLICK HERE TO LEARN MORE
Special Offer: Try the 'Picks Membership' for ONLY $37!
CLICK HERE TO LEARN MORE
The first week of September underscored the market’s tug-of-war between exuberant tech strength and a slowing economic backdrop. Early gains pushed the Nasdaq to new record highs, powered by AI-linked giants and investor optimism that the Federal Reserve will soon begin easing policy. But momentum proved fragile, as weak labor data and recessionary undertones reminded investors that softer conditions, not just monetary stimulus, are driving the conversation.
The Nasdaq Composite set a fresh intraday high at 21,885.62, extending its leadership streak and notching another closing record. Tech and AI name, including Broadcom, Lam Research, Palantir, and Nvidia, carried the S&P 500 higher even as broader participation faltered. Beneath the surface, however, market breadth weakened: fewer than half of S&P components managed gains, underscoring just how concentrated leadership has become.
Meanwhile, Treasury yields continued their slide. The 10-year note fell further on expectations that rate cuts are imminent, while the 30-year yield hovered near 5% after last week’s volatility. The decline was reinforced by data showing a cooler labor market and waning confidence in tariffs as a lasting inflation driver.
Economic Data and Fed Expectations
Friday’s August jobs report capped the week with a sobering reminder that the labor market is losing steam. Nonfarm payrolls increased by just 22,000, well below expectations, while prior months were revised downward. The unemployment rate climbed to 4.3%, the highest since 2021. Weakness in manufacturing and wholesale trade stood out, while hiring in healthcare and services prevented a steeper miss.
Investors initially welcomed the softer figures as evidence the Fed would accelerate its pivot to rate cuts. Futures now price in near-certainty of a quarter-point cut at the September 17 FOMC meeting, with a greater than 70% chance of three cuts by year-end. Yet the enthusiasm quickly faded as markets recognized the underlying risk: easing policy is only bullish if it stabilizes growth before recessionary forces take hold.
Adding to the cautious tone, August CPI, due this Thursday, is expected to show a modest uptick to 2.9% year-over-year, with core inflation holding at 3.1%. A hotter reading would complicate the Fed’s calculus, pitting the need for stimulus against the risk of re-anchoring inflation expectations.
Gold surged to fresh all-time highs, with futures briefly touching $3,685/oz. The rally reflects a dual driver: falling yields making non-yielding assets more attractive, and rising safe-haven demand as investors hedge against both recession and policy missteps. The move underscores the defensive undercurrent in sentiment even as equities test new highs.
Market Outlook
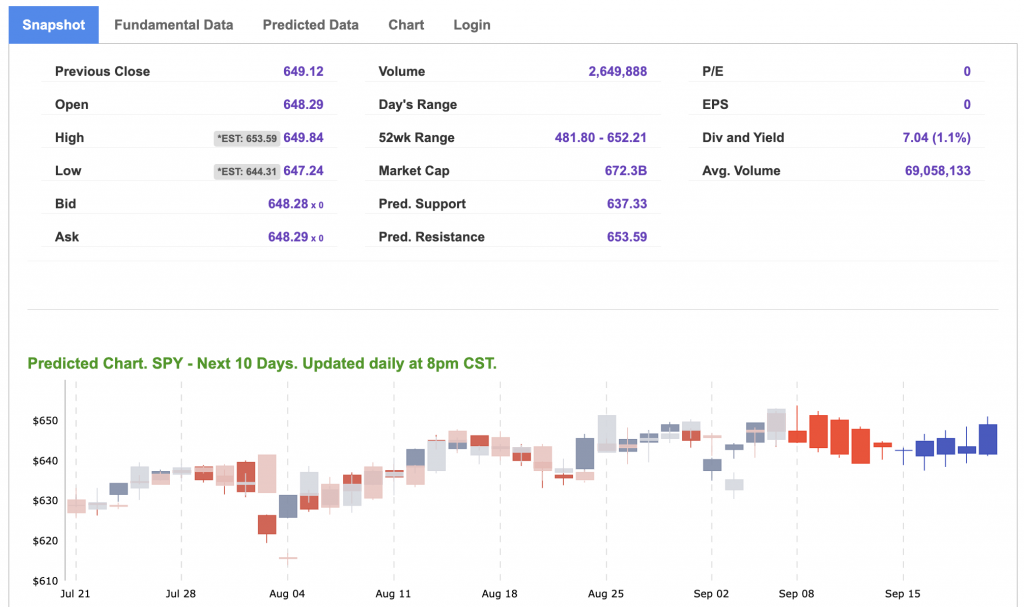
For now, the SPDR S&P 500 ETF Trust (SPY) continues to trade within a well-defined band. Resistance remains firm at 650–660, while downside support is clustered in the 600–620 zone. With volatility compressed around major data releases, sideways action appears likely until the September FOMC meeting provides clarity.
Investors should brace for more whiplash as headlines swing between “Fed rescue” and “economic slowdown.” The defining question isn’t whether the Fed will cut rates—it will—but whether those cuts can meaningfully offset labor market weakness, tariff uncertainty, and global debt pressures before the downturn accelerates.
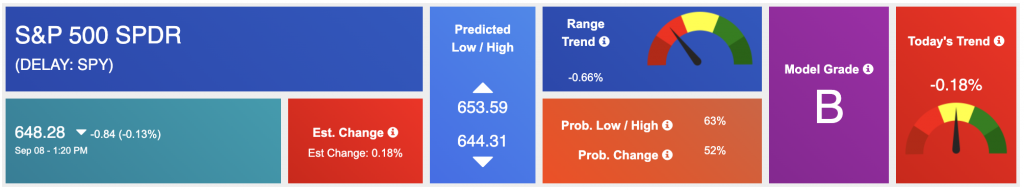
Using the “SPY” symbol to analyze the S&P 500, our 10-day prediction window shows a near-term positive outlook. Prediction data is uploaded after the market closes at 6 p.m. CST. Today’s data is based on market signals from the previous trading session.
Our featured symbol for Tuesday is SLV. Silver Trust iShares. is showing a steady vector in our Stock Forecast Toolbox’s 10-day forecast.
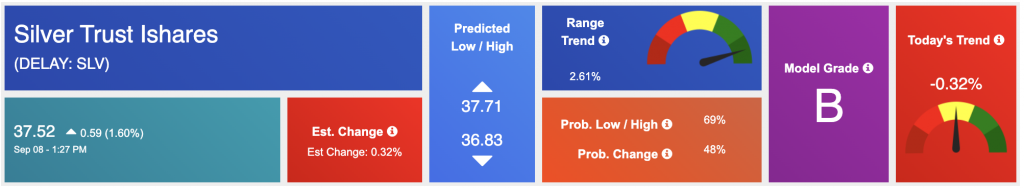
The symbol is trading at $111.94 with a vector of -0.55% at the time of publication.
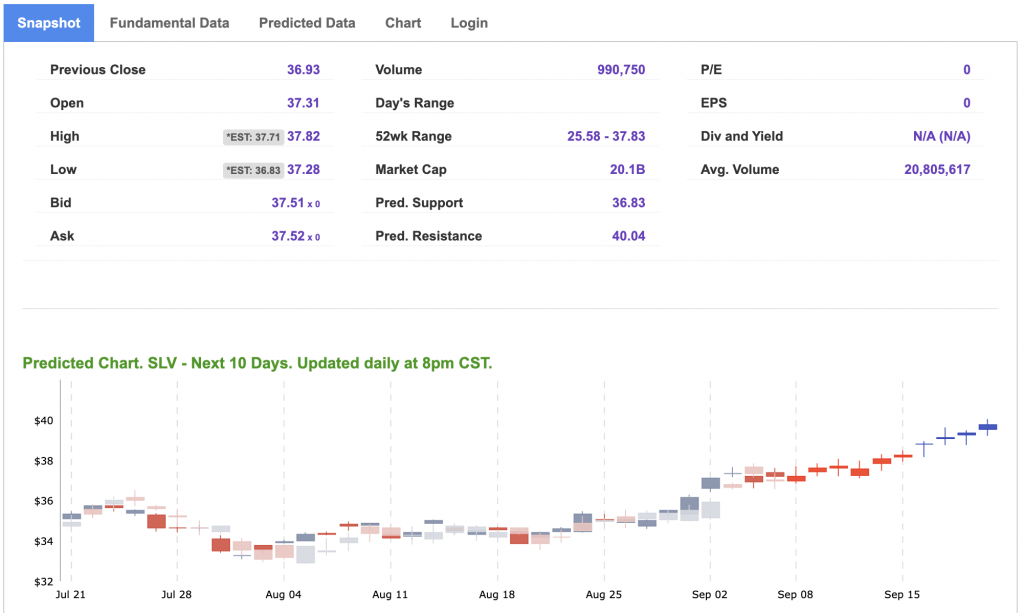
10-Day Prediction data is uploaded after the market close at 6 p.m., CST. Today’s data is based on market signals from the previous trading session.
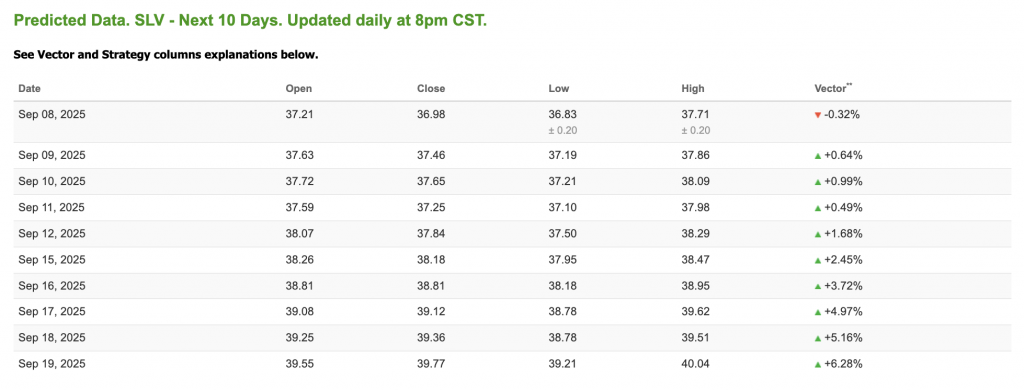
Note: The Vector column calculates the change of the Forecasted Average Price for the next trading session relative to the average of actual prices for the last trading session. The column shows the expected average price movement “Up or Down”, in percent. Trend traders should trade along the predicted direction of the Vector. The higher the value of the Vector the higher its momentum.
*Please note: At the time of publication, Vlad Karpel does have a position in the featured symbol, slv. Our featured symbol is part of your free subscription service. It is not included in any paid Tradespoon subscription service. Vlad Karpel only trades his money in paid subscription services. If you are a paid subscriber, please review your Premium Member Picks, ActiveTrader, or MonthlyTrader recommendations. If you are interested in receiving Vlad’s picks, please click here.
West Texas Intermediate for Crude Oil delivery (CL.1) is priced at $62.37 per barrel, up 0.81%, at the time of publication.
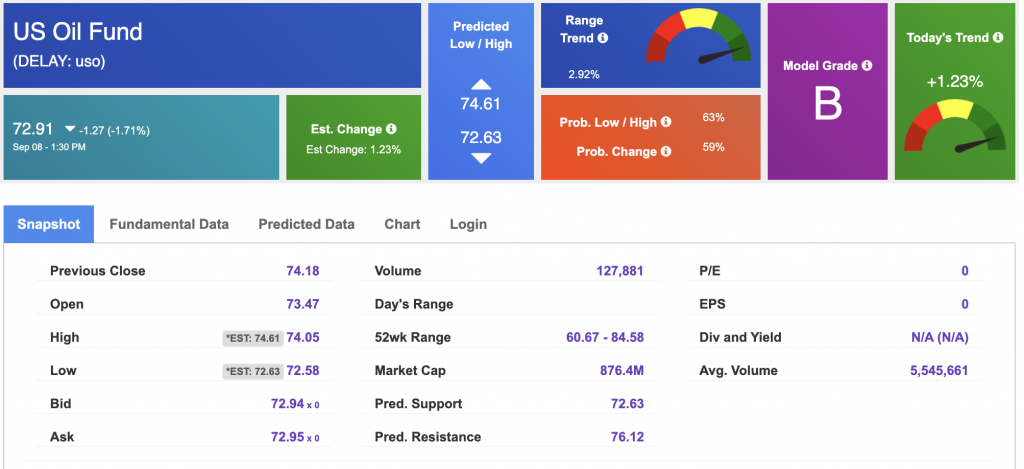
Looking at USO, a crude oil tracker, our 10-day prediction model shows mixed signals. The fund is trading at $72.91 at the time of publication. Prediction data is uploaded after the market close at 6 p.m., CST. Today’s data is based on market signals from the previous trading session.
The price for the Gold Continuous Contract (GC00) is up 0.61% at $3,675.30 at the time of publication.
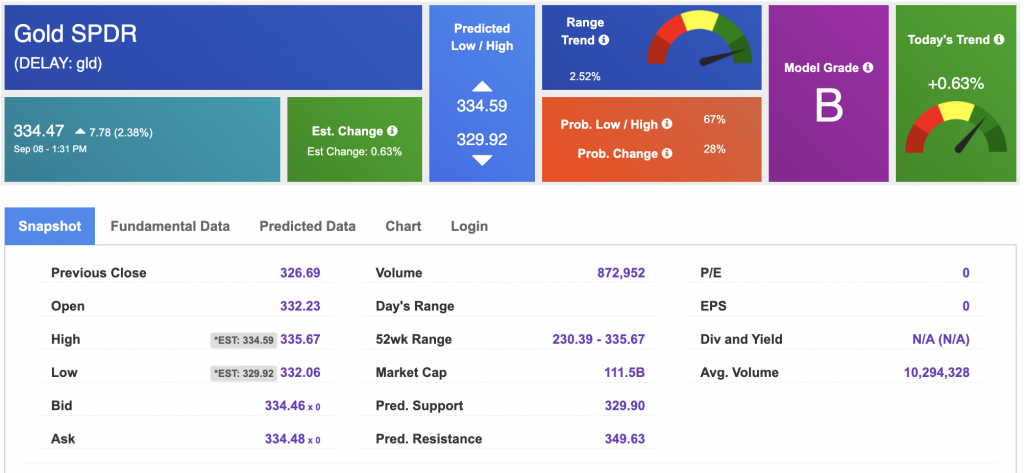
Using SPDR GOLD TRUST (GLD) as a tracker in our Stock Forecast Tool, the 10-day prediction window shows mixed signals. The gold proxy is trading at $334.47 at the time of publication. Vector signals show +0.63% for today. Prediction data is uploaded after the market close at 6 p.m., CST. Today’s data is based on market signals from the previous trading session.
The yield on the 10-year Treasury note is down at 4.05% at the time of publication.
The yield on the 30-year Treasury note is down at 4.692% at the time of publication.
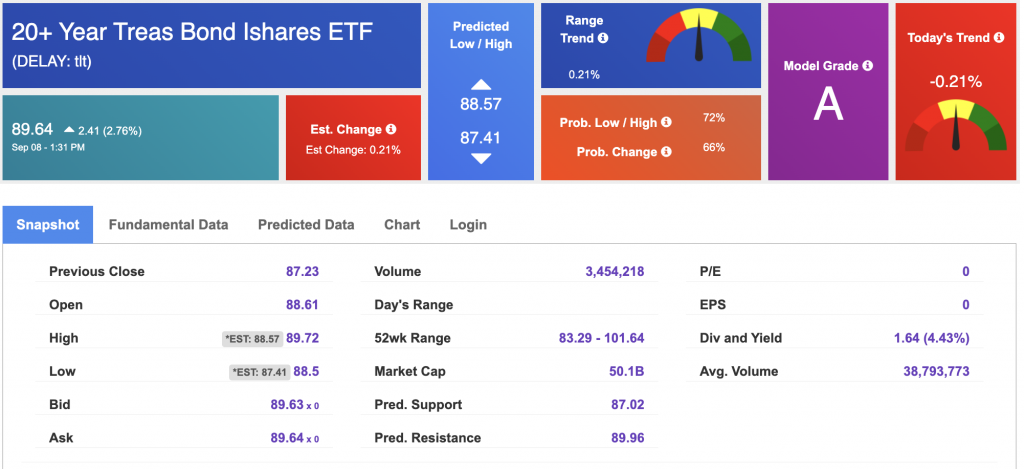
Using the iShares 20+ Year Treasury Bond ETF (TLT) as a proxy for bond prices in our Stock Forecast Tool, we see mixed signals in our 10-day prediction window. Prediction data is uploaded after the market close at 6 p.m., CST. Today’s data is based on market signals from the previous trading session.
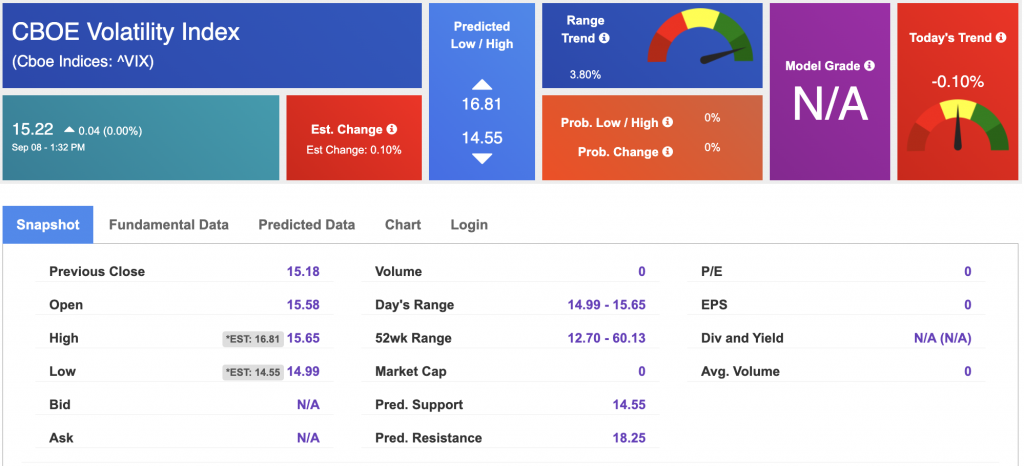
The CBOE Volatility Index (^VIX) is priced at $15.22 at the time of publication, and our 10-day prediction window shows mixed signals. Prediction data is uploaded after the market close at 6 p.m., CST. Today’s data is based on market signals from the previous trading session.
Please share this Tradespoon Market Commentary with your friends.
![]()

![]()
Comments Off on


Tradespoon Tools make finding winning trades in minute as easy as 1-2-3.
Our simple 3 step approach has resulted in an average return of almost 20% per trade!