 Special Offer: Try the 'Picks Membership' for ONLY $37!
CLICK HERE TO LEARN MORE
Special Offer: Try the 'Picks Membership' for ONLY $37!
CLICK HERE TO LEARN MORE
U.S. equities opened the week in the green, but make no mistake—this is no risk-on rally. While the S&P 500, Dow, and Nasdaq are all posting gains, the VIX is quietly moving higher, reflecting the market’s growing unease. This rare divergence—stocks rising while volatility also ticks up—signals deeper concerns brewing beneath the surface.
After a June rally that briefly brought the S&P 500 within striking distance of all-time highs, macro headwinds are beginning to gather force again. Tariffs and intensifying Middle East conflict are darkening the outlook, and with a full slate of economic data and Fed commentary on deck, the coming weeks could set the tone for a volatile summer.
Brent crude rose 0.4% to $77.30 a barrel on Monday, continuing a steep climb from the $62 level it held earlier this month. The surge in oil prices reflects Wall Street’s growing concern over a potential escalation in the Middle East. Over the weekend, U.S. forces reportedly struck Iran’s nuclear infrastructure, and Israel’s latest operations include strikes on Evin Prison, known for detaining political dissidents. These developments have injected fresh geopolitical risk into an already fragile market environment.
Meanwhile, the 10-year Treasury yield slipped to 4.35%, its lowest level since early May, as investors rotated into safe-haven assets. The yield briefly touched 4.4% earlier in the day before retreating, suggesting strong demand for government bonds amid global uncertainty. Historically, lower yields indicate rising bond prices—often a signal that traders are hedging against economic or geopolitical shocks.
Trade concerns are once again front and center. Two key tariff pauses—initiated under the Biden administration—are set to expire soon. A 90-day delay on broad reciprocal tariffs ends on July 9, while a separate hold on China-specific levies runs out on August 12. Markets are bracing for the possible reintroduction of duties on electric vehicles, semiconductors, and consumer goods, which could reignite inflation and disrupt supply chains.
Adding to the uncertainty, Federal Reserve Chair Jerome Powell will deliver his semiannual monetary policy testimony to Congress this Tuesday and Wednesday. While the Fed held rates steady last week, Powell’s comments will be closely parsed for any shift in tone, especially as inflation cools and labor markets show signs of strain.
The Fed’s June Summary of Economic Projections hinted at a slowing economy, with real GDP expected to grow just 1.4% this year. Officials forecast an uptick in unemployment to 4.5% and noted that inflation remains “somewhat elevated.” Still, not all voices within the Fed are aligned. Governor Christopher Waller, considered a possible successor to Powell under a second Trump administration, suggested Friday that tariffs won’t drive long-term inflation and called for rate cuts as soon as July.
Last week, the S&P 500 managed to hold its key support but struggled to build momentum toward the breakout range of $600–$620. Despite brief moments of optimism—fueled by hopes for geopolitical de-escalation and a dovish Fed pivot—traders remained cautious. Breadth weakened across sectors, and the rally continued to depend heavily on a narrow group of tech leaders.
For now, our outlook remains market-neutral. With volatility elevated, risks to the downside remain firmly in play, especially if economic data worsens or geopolitical tensions flare further. The fragility of this rally is becoming more apparent, and unless either inflation trends decisively lower or the Fed signals clear easing intentions, a sustained breakout appears unlikely.
This week brings a heavy calendar of market-moving economic data:
The PCE report on Friday is arguably the most important. A softer reading could revive rate cut hopes and provide support to equities, while any upside surprise may reinforce the Fed’s cautious stance and weigh on growth-sensitive sectors.
Earnings from KB Home, FactSet, Lufax, and Compass Diversified will also provide insight into the housing sector, consumer spending, and demand for analytics—important bellwethers in a data-dependent market.
Despite surface-level strength, this market is walking a tightrope. Rising oil prices, tariff threats, Middle East instability, and diverging Fed views are all combining to cloud the path forward. With SPY still stuck in its $540–$550 range and volatility creeping upward, we anticipate more choppy, sideways action until there’s a clear catalyst—be it a decisive policy shift or economic clarity—to break the current stalemate. For reference, the SPY Seasonal Chart is shown below:
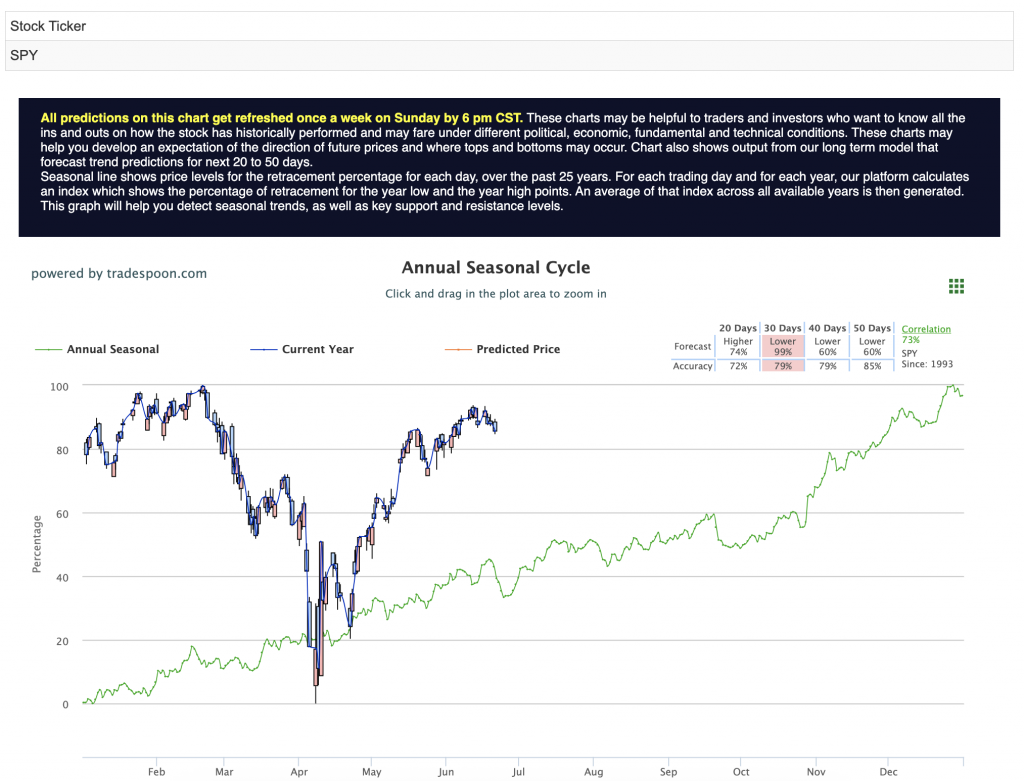
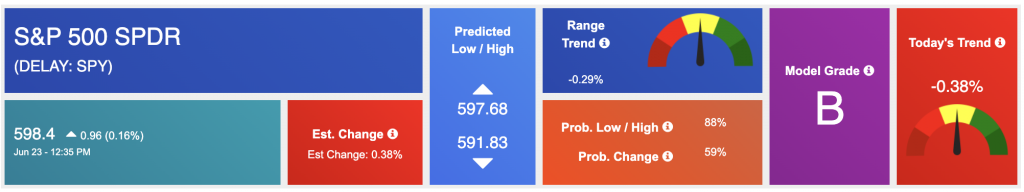
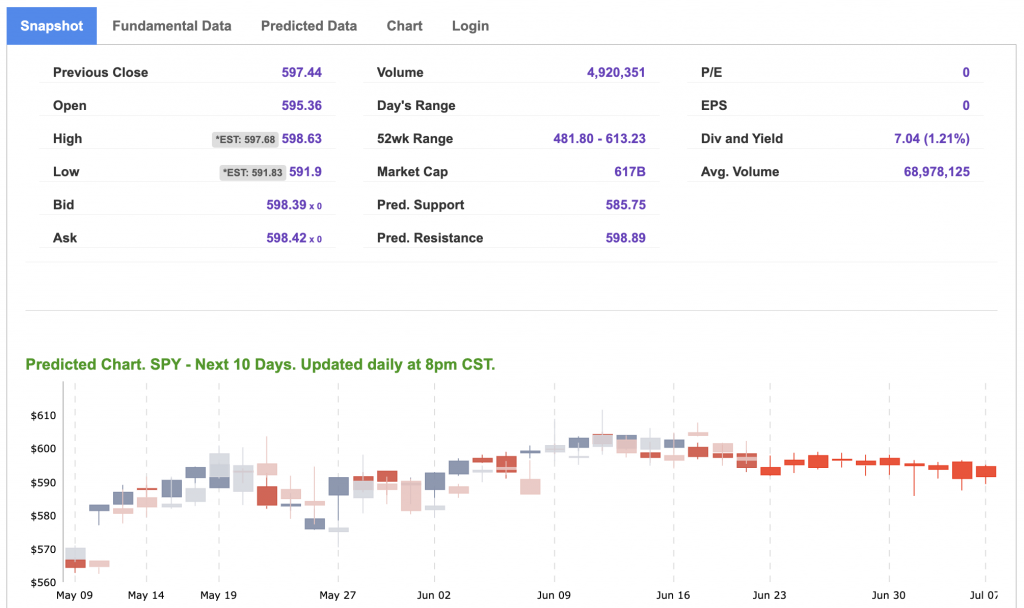
Using the “SPY” symbol to analyze the S&P 500, our 10-day prediction window shows a near-term positive outlook. Prediction data is uploaded after the market closes at 6 p.m. CST. Today’s data is based on market signals from the previous trading session.
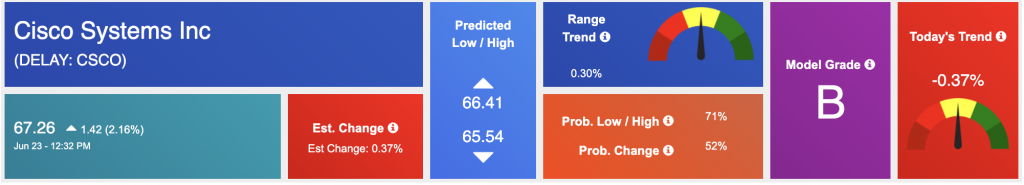
Our featured symbol for Tuesday is CSCO. Cisco Systems Inc. – CSCO is showing a steady vector in our Stock Forecast Toolbox’s 10-day forecast.

The symbol is trading at $67.28 with a vector of -0.37% at the time of publication.
10-Day Prediction data is uploaded after the market close at 6 p.m., CST. Today’s data is based on market signals from the previous trading session.
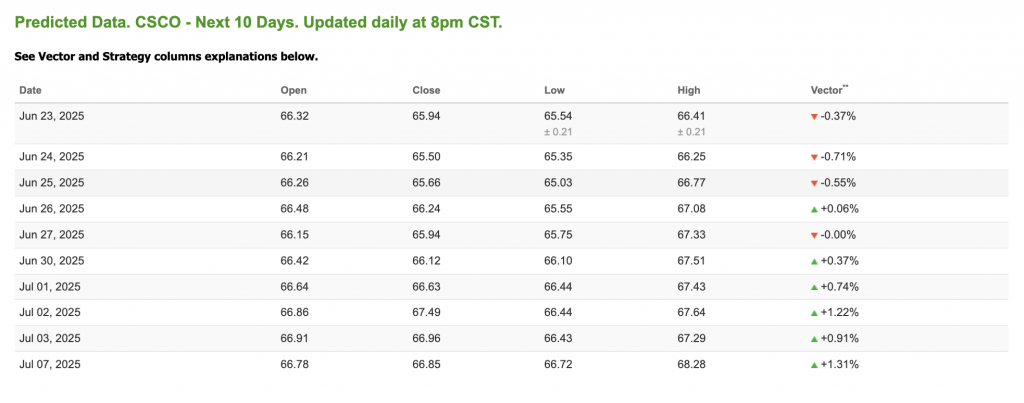
Note: The Vector column calculates the change of the Forecasted Average Price for the next trading session relative to the average of actual prices for the last trading session. The column shows the expected average price movement “Up or Down”, in percent. Trend traders should trade along the predicted direction of the Vector. The higher the value of the Vector the higher its momentum.
*Please note: At the time of publication, Vlad Karpel does have a position in the featured symbol, CSCO. Our featured symbol is part of your free subscription service. It is not included in any paid Tradespoon subscription service. Vlad Karpel only trades his money in paid subscription services. If you are a paid subscriber, please review your Premium Member Picks, ActiveTrader, or MonthlyTrader recommendations. If you are interested in receiving Vlad’s picks, please click here.
West Texas Intermediate for Crude Oil delivery (CL.1) is priced at $69.60 per barrel, down 5.72%, at the time of publication.
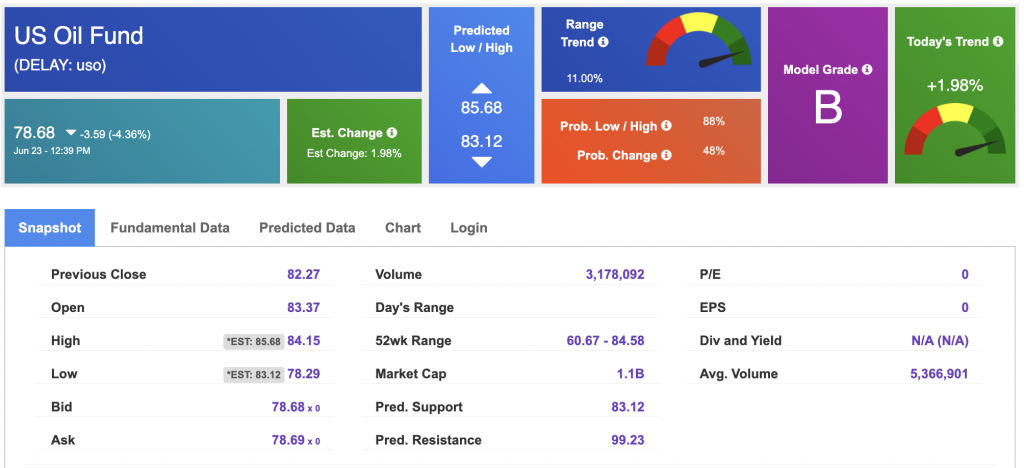
Looking at USO, a crude oil tracker, our 10-day prediction model shows mixed signals. The fund is trading at $78.68 at the time of publication. Prediction data is uploaded after the market close at 6 p.m., CST. Today’s data is based on market signals from the previous trading session.
The price for the Gold Continuous Contract (GC00) is UP 0.37% at $3,398.00 at the time of publication.
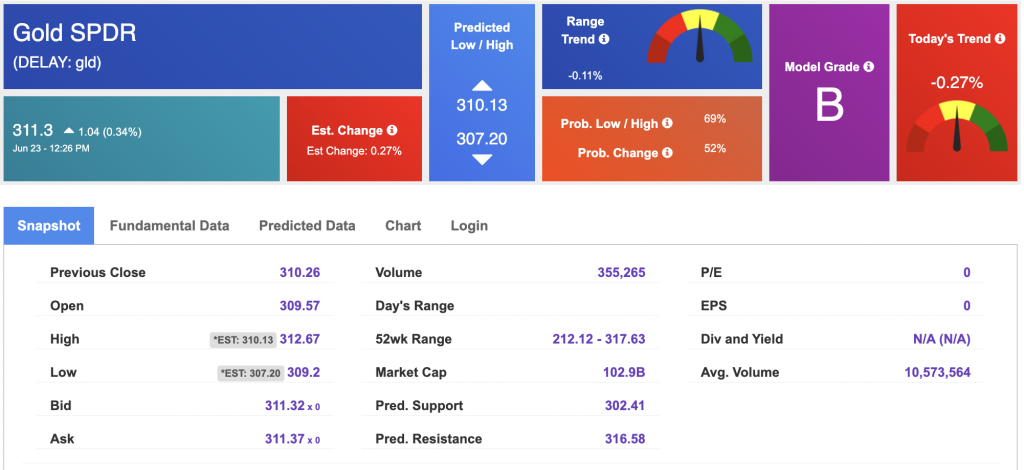
Using SPDR GOLD TRUST (GLD) as a tracker in our Stock Forecast Tool, the 10-day prediction window shows mixed signals. The gold proxy is trading at $313.19 at the time of publication. Vector signals show +2.08% for today. Prediction data is uploaded after the market close at 6 p.m., CST. Today’s data is based on market signals from the previous trading session.
The yield on the 10-year Treasury note is down at 4.31% at the time of publication.
The yield on the 30-year Treasury note is down at 4.84% at the time of publication.
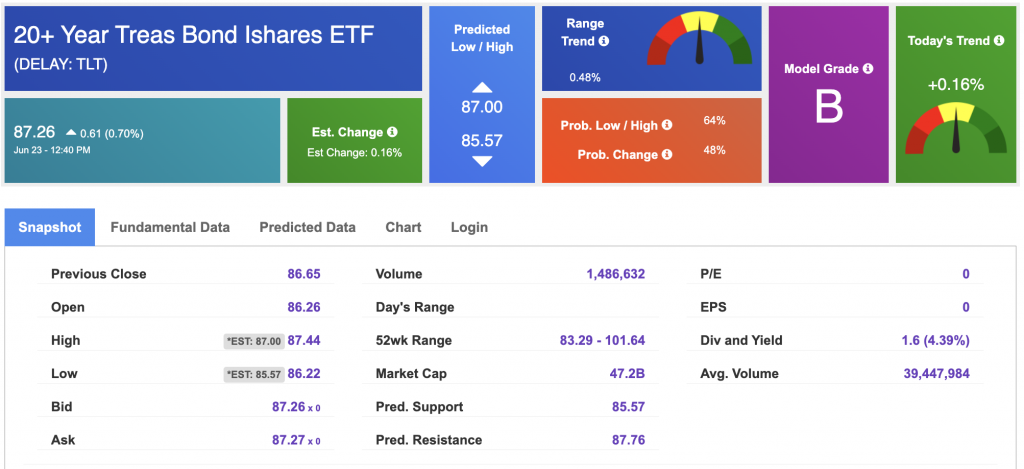
Using the iShares 20+ Year Treasury Bond ETF (TLT) as a proxy for bond prices in our Stock Forecast Tool, we see mixed signals in our 10-day prediction window. Prediction data is uploaded after the market close at 6 p.m., CST. Today’s data is based on market signals from the previous trading session.
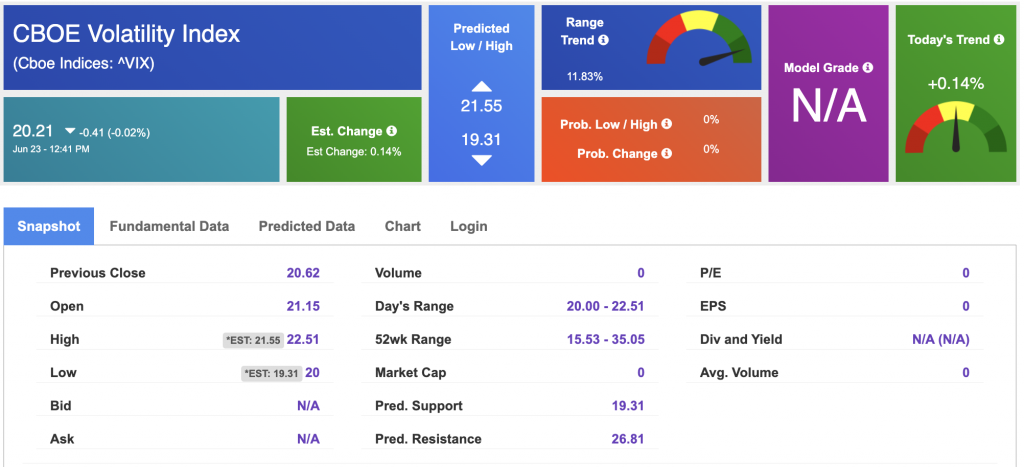
The CBOE Volatility Index (^VIX) is priced at $20.21 at the time of publication, and our 10-day prediction window shows mixed signals. Prediction data is uploaded after the market close at 6 p.m., CST. Today’s data is based on market signals from the previous trading session.
Please share this Tradespoon Market Commentary with your friends.
![]()

![]()
Comments Off on


Tradespoon Tools make finding winning trades in minute as easy as 1-2-3.
Our simple 3 step approach has resulted in an average return of almost 20% per trade!

