 Save Big on Commissions ($0.65 per Contract)
CLICK HERE TO LEARN MORE
Save Big on Commissions ($0.65 per Contract)
CLICK HERE TO LEARN MORE
The financial markets experienced a rollercoaster ride on Monday as stocks surrendered early gains and closed in the red, spurred by a surge in bond yields and escalating tensions in the Middle East. This latest downturn comes on the heels of a tumultuous week marked by inflation concerns and geopolitical uncertainties, signaling a period of heightened volatility and uncertainty for investors.
Over the weekend, geopolitical tensions flared as Iran launched a barrage of drones and missiles toward Israel, sparking fears of a wider conflict. While most threats were neutralized with assistance from the U.S. and other nations, the incident served as a stark reminder of the fragility of global stability and its impact on financial markets.
Meanwhile, March’s retail sales figures painted a picture of robust consumer spending, with a 0.7% surge compared to February, surpassing economists’ expectations. Core retail sales, excluding volatile sectors, also exceeded forecasts with a 1% increase, highlighting underlying strength in consumer demand despite broader economic headwinds.
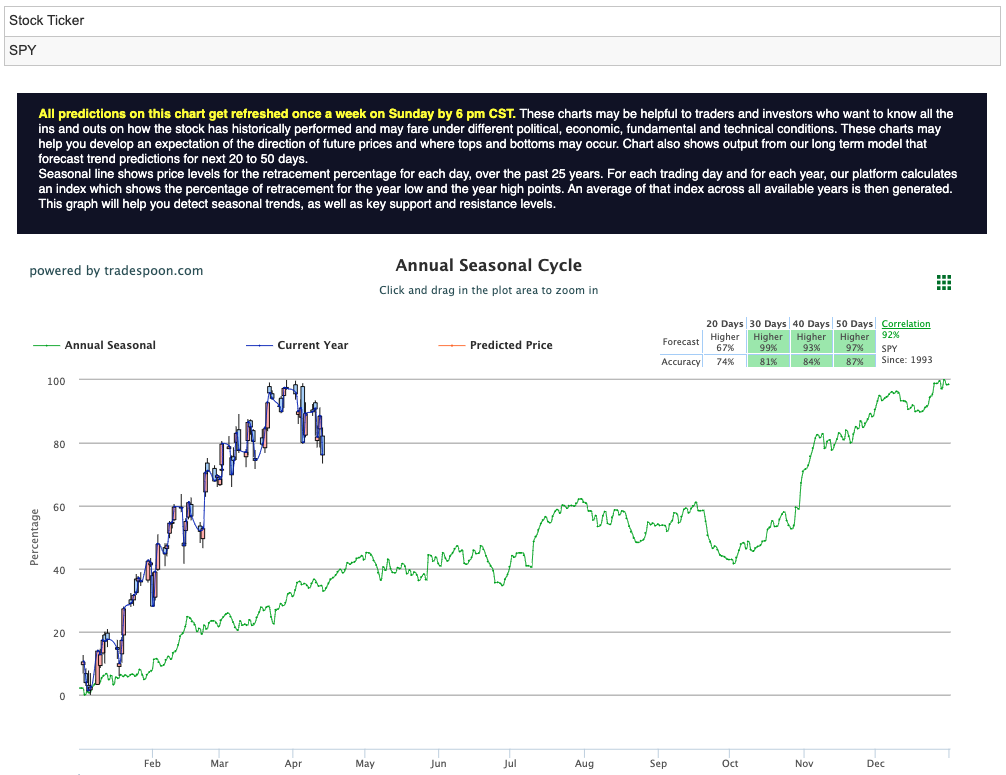
Amidst these developments, the SPY projections indicate a range of $530-$540, with support expected at $490-$500, reflecting ongoing market volatility and investor caution. These levels serve as critical benchmarks for traders navigating the choppy waters of the current market environment. For reference, the SPY Seasonal Chart is shown below:
Looking ahead, investors are bracing for a flurry of earnings reports from major companies including UnitedHealth Group, Bank of America, Johnson & Johnson, Abbott Laboratories, Netflix, and Procter & Gamble. These reports will provide valuable insights into corporate performance and serve as key drivers of market sentiment in the coming weeks.
As traders await guidance from the Federal Reserve ahead of its April 30 to May 1 meeting, all eyes are on Fed Chair Jerome Powell and Vice Chair Philip Jefferson, who are scheduled to speak on Tuesday. Their remarks will be closely scrutinized for clues about the central bank’s stance on interest rates and its approach to managing inflationary pressures amidst a backdrop of economic uncertainty.
The surge in retail sales figures has exerted upward pressure on Treasury yields, with the 10-year Treasury yield climbing to 4.661%, its highest level since November. This uptick reflects shifting expectations around interest rates and inflation, adding to market jitters and fueling speculation about the Fed’s next moves.
In conclusion, the financial markets are navigating choppy waters characterized by rising bond yields, geopolitical tensions, and strong retail sales figures. As investors await further clarity from earnings reports and central bank announcements, adaptability and vigilance remain paramount in navigating the complexities of today’s market landscape.
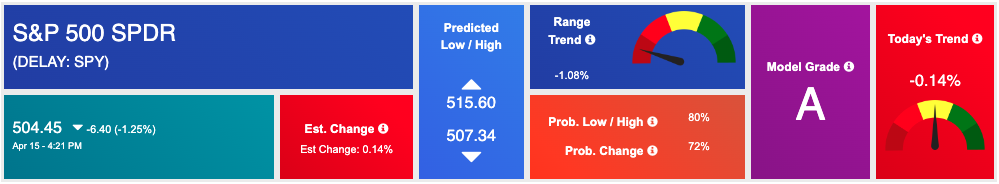
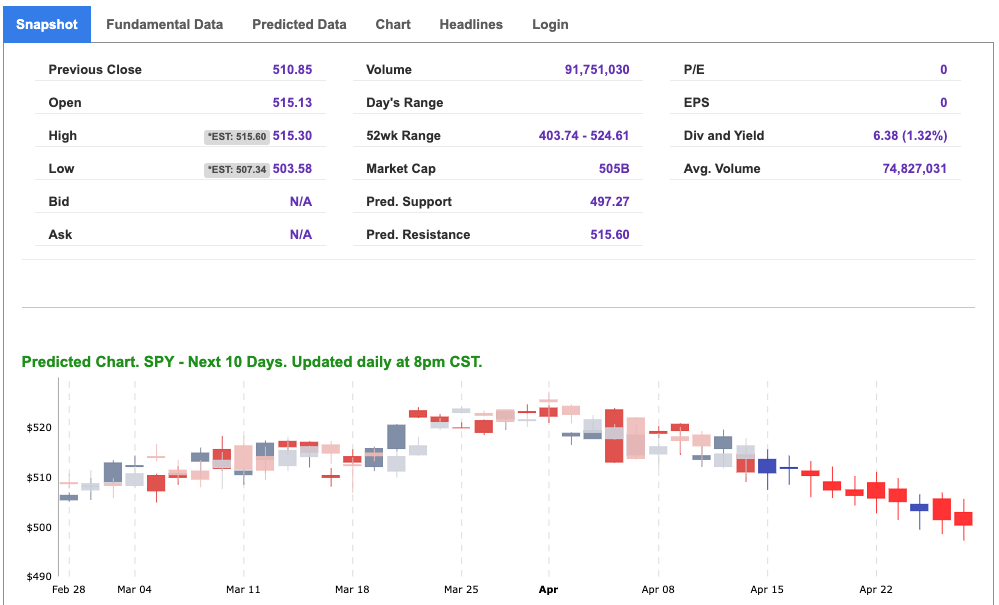
Using the “SPY” symbol to analyze the S&P 500 our 10-day prediction window shows a near-term positive outlook. Prediction data is uploaded after the market closes at 6 p.m. CST. Today’s data is based on market signals from the previous trading session.
Note: The Vector column calculates the change of the Forecasted Average Price for the next trading session relative to the average of actual prices for the last trading session. The column shows the expected average price movement “Up or Down”, in percent. Trend traders should trade along the predicted direction of the Vector. The higher the value of the Vector the higher its momentum.
*Please note: At the time of publication Vlad Karpel does have a position in the featured symbol, GLD. Our featured symbol is part of your free subscription service. It is not included in any paid Tradespoon subscription service. Vlad Karpel only trades his money in paid subscription services. If you are a paid subscriber, please review your Premium Member Picks, ActiveTrader, or MonthlyTrader recommendations. If you are interested in receiving Vlad’s picks, please click here.
West Texas Intermediate for Crude Oil delivery (CL.1) is priced at $85.65 per barrel, down 0.01%, at the time of publication.
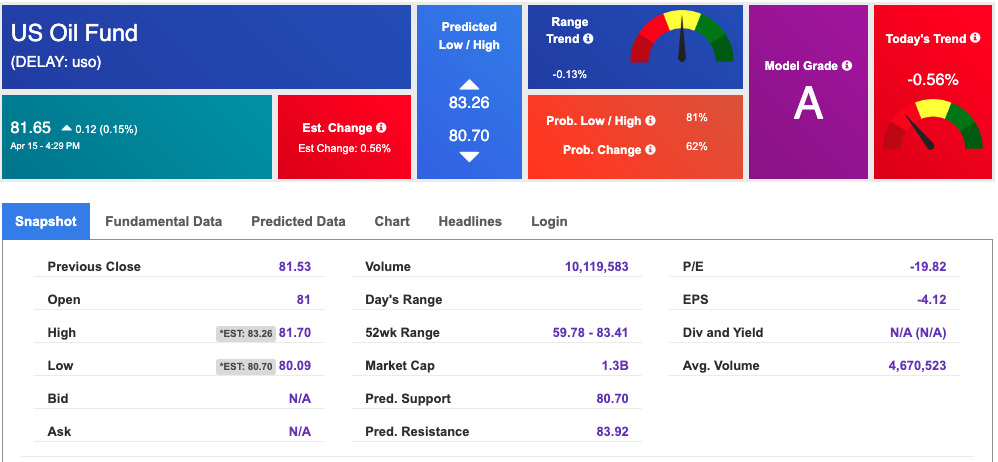
Looking at USO, a crude oil tracker, our 10-day prediction model shows mixed signals. The fund is trading at $81.65 at the time of publication. Prediction data is uploaded after the market close at 6 p.m., CST. Today’s data is based on market signals from the previous trading session.
The price for the Gold Continuous Contract (GC00) is up 1.06% at $2399.30 at the time of publication.
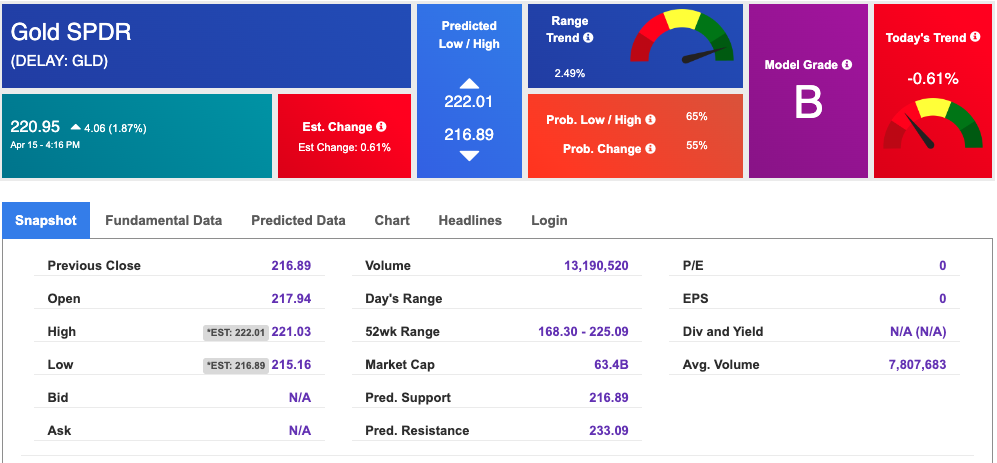
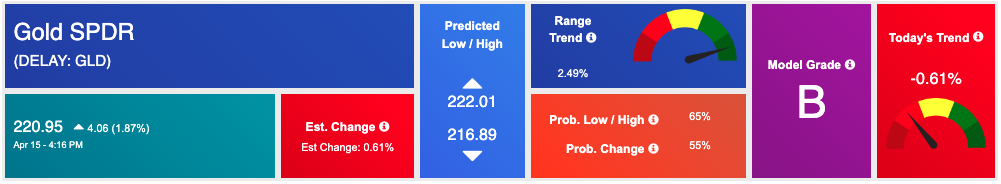
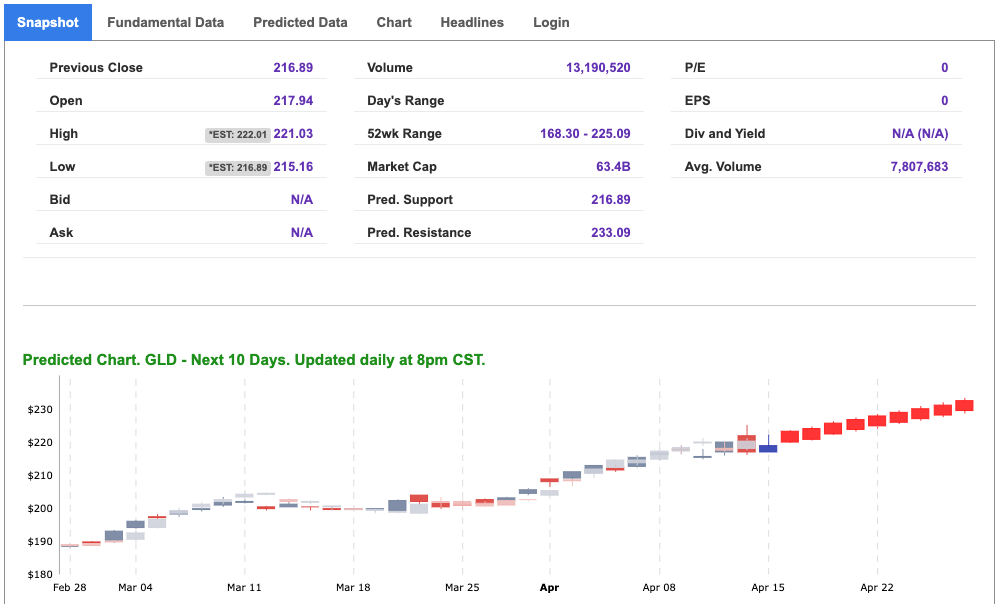
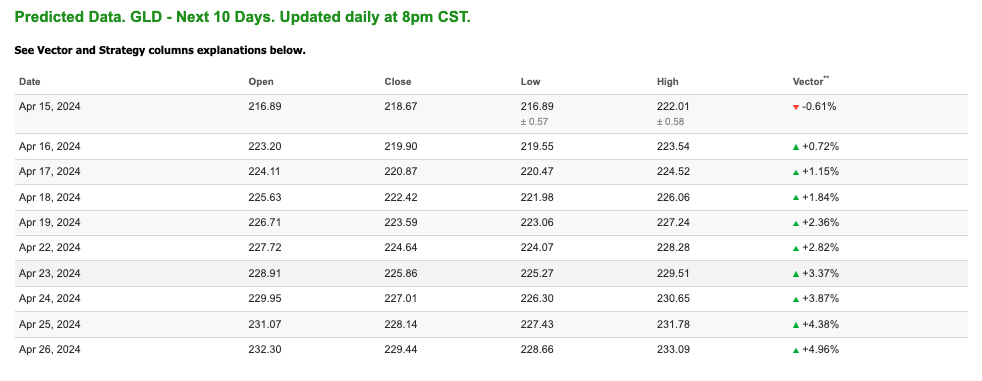
Using SPDR GOLD TRUST (GLD) as a tracker in our Stock Forecast Tool, the 10-day prediction window shows mixed signals. The gold proxy is trading at $220.95 at the time of publication. Vector signals show -0.61% for today. Prediction data is uploaded after the market close at 6 p.m., CST. Today’s data is based on market signals from the previous trading session.
The yield on the 10-year Treasury note is up at 4.608% at the time of publication.
The yield on the 30-year Treasury note is up at 4.722% at the time of publication.
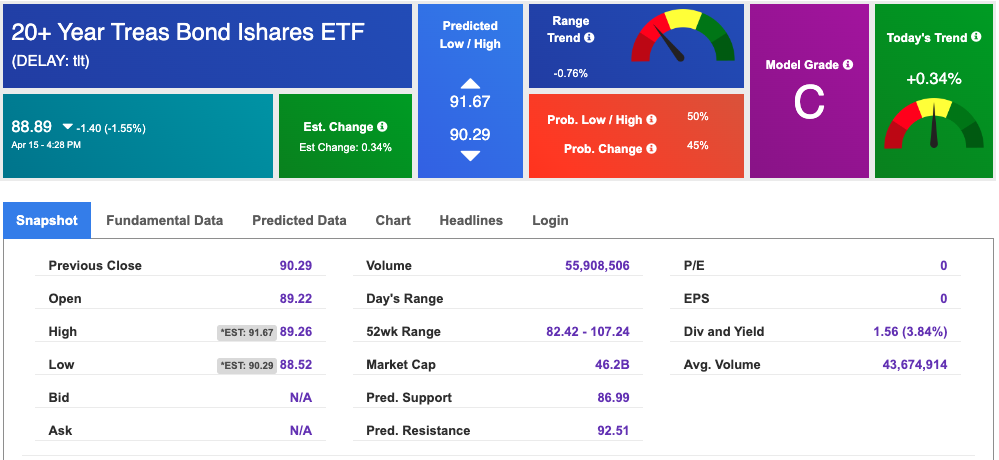
Using the iShares 20+ Year Treasury Bond ETF (TLT) as a proxy for bond prices in our Stock Forecast Tool, we see mixed signals in our 10-day prediction window. Prediction data is uploaded after the market close at 6 p.m., CST. Today’s data is based on market signals from the previous trading session.
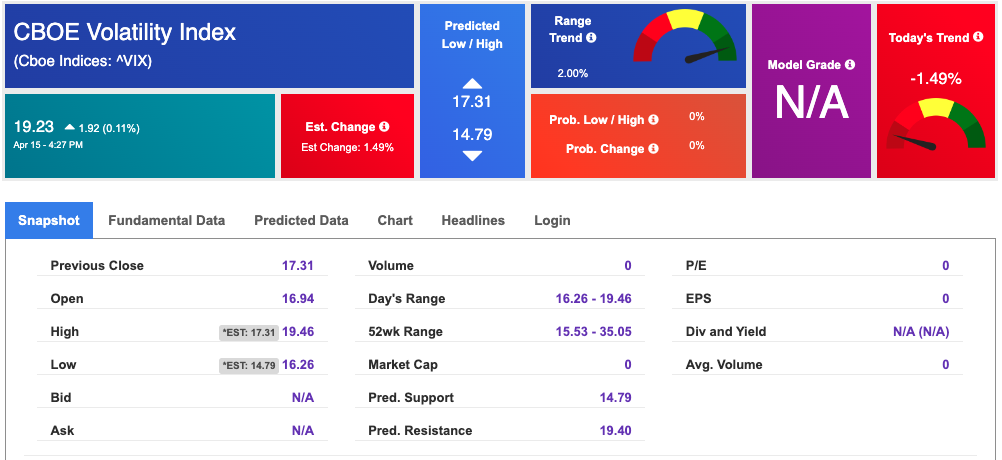
The CBOE Volatility Index (^VIX) is priced at $19.23 up 0.11% at the time of publication, and our 10-day prediction window shows mixed signals. Prediction data is uploaded after the market close at 6 p.m., CST. Today’s data is based on market signals from the previous trading session.
Please share this Tradespoon Market Commentary with your friends.
![]()

![]()
Comments Off on


Tradespoon Tools make finding winning trades in minute as easy as 1-2-3.
Our simple 3 step approach has resulted in an average return of almost 20% per trade!