 Special Offer: Try the 'SpreadTrader Membership' for ONLY $37!
CLICK HERE TO LEARN MORE
Special Offer: Try the 'SpreadTrader Membership' for ONLY $37!
CLICK HERE TO LEARN MORE
As the U.S. stock market embarks on a new week, the momentum from its recent nine-day winning streak is under pressure. While the Dow has managed to continue climbing, buoyed by its blue-chip stocks, the Nasdaq and S&P 500 are lagging, as concerns over tariffs and economic uncertainty continue to make their presence felt.
The Dow has remained resilient, with companies like American Express, UnitedHealth, and Visa driving the index higher. But broader market sentiment is more fragile. On Monday, major tech stocks like Apple, Amazon, and Nvidia were dragging down the S&P 500, with only 14 of its 30 members making gains. This contrast highlights the narrow breadth of the market rally, which remains heavily dependent on a select few names in Big Tech.
President Trump’s rhetoric on tariffs has reignited market volatility. On the heels of Friday’s strong April jobs report, Trump called for new tariffs on foreign-produced films, escalating tensions just as the market had started to stabilize. The looming tariff threat has once again placed global trade relations in the spotlight, making investors uneasy.
Economic Data Signals Mixed Outlook
Despite the tension, some positive economic indicators have provided temporary relief. The U.S. services PMI exceeded expectations, showing that the services sector is still expanding, though the broader economic outlook remains cautious. The jobs report for April was a mixed bag, revealing a solid gain of 177,000 jobs, but an uptick in jobless claims to 241,000 suggests cracks are starting to show beneath the surface.
Markets are looking toward Wednesday’s Federal Reserve meeting for further clarity. The consensus remains that the central bank will hold interest rates steady, despite pressure from President Trump to lower them. This stance is supported by recent economic data, which suggests that inflation remains a concern, and any significant rate cuts may be premature.
Tariff Concerns and Their Impact on Tech
The mixed performance in the tech sector has highlighted how sensitive certain industries are to the ongoing trade tension. Apple’s recent earnings report, which showed stronger-than-expected iPhone sales but weaker results in Greater China, has weighed heavily on its stock price. Investors are increasingly concerned about the company’s vulnerability to escalating tariffs, especially as China remains a critical market for its products.
Meanwhile, Microsoft and Meta have stood out with strong earnings, with both companies delivering impressive growth in cloud and advertising revenues. Microsoft’s Azure cloud division has shown strong growth, which helped push the company’s market cap to a record high, surpassing Apple as the largest U.S. company by market capitalization. These positive results have helped support investor sentiment, but broader market trends remain mixed.
Berkshire Hathaway’s Transition and Market Sentiment
In other notable news, Warren Buffett’s announcement that he would step down as CEO of Berkshire Hathaway at the end of the year sent shockwaves through the market. While Buffett’s decision to hand over the reins to his successor, Greg Abel, was expected, the news caused Berkshire’s Class B shares to drop by 4.2%. The company’s Q1 earnings report showed a 14% decline in operating profit, driven by lower insurance underwriting profits and currency losses. The cash pile at Berkshire grew to $348 billion, but Buffett’s cautious stance on deploying that capital has raised questions about the company’s next steps.
Buffett also spoke out on the ongoing trade tensions, emphasizing the dangers of using trade as a weapon and urging the U.S. to engage in fair trade practices with the rest of the world. His comments align with growing concerns about the global economy’s vulnerability to trade disruptions, and investors are closely watching how these tensions will evolve in the coming months.
Looking Ahead: A Market at Crossroads
The market now finds itself at a crossroads. While earnings have largely exceeded expectations, the strength of the recovery appears to be narrowing. The broader market rally is increasingly dependent on a few key stocks, with much of the strength concentrated in the tech sector. Investors are particularly concerned about the impact of tariffs on global companies, and the growing uncertainty around trade policy remains a critical risk factor.
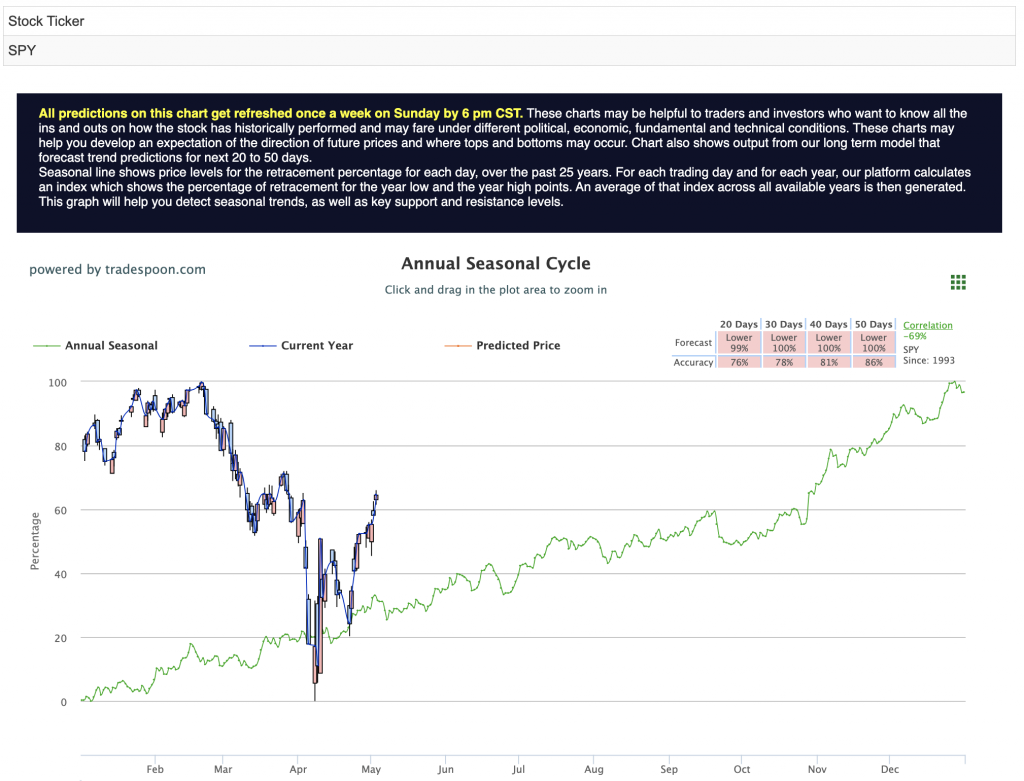
As we move through May, with the Federal Reserve meeting on the horizon, market participants are bracing for more volatility. With SPY facing resistance near the 565–580 range and support between 500–530, a market-neutral outlook seems prudent for now. For reference, the SPY Seasonal Chart is shown below:
The risk of recession is rising, and inflationary pressures are unlikely to ease anytime soon, keeping interest rates elevated through the latter half of the year. For now, the market’s direction remains uncertain. Will the recent rally prove to have lasting momentum, or will the storm of trade tensions and macroeconomic challenges drag stocks lower once again? Investors will need to stay vigilant, ready to react as the next wave of economic data and trade headlines emerges.
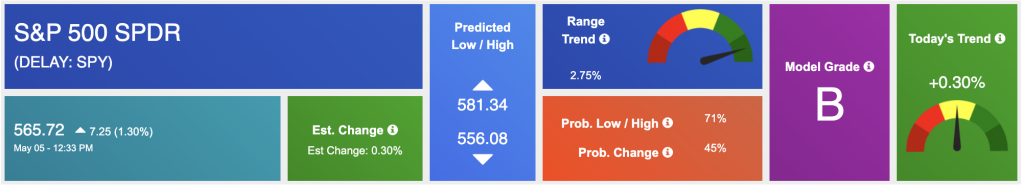
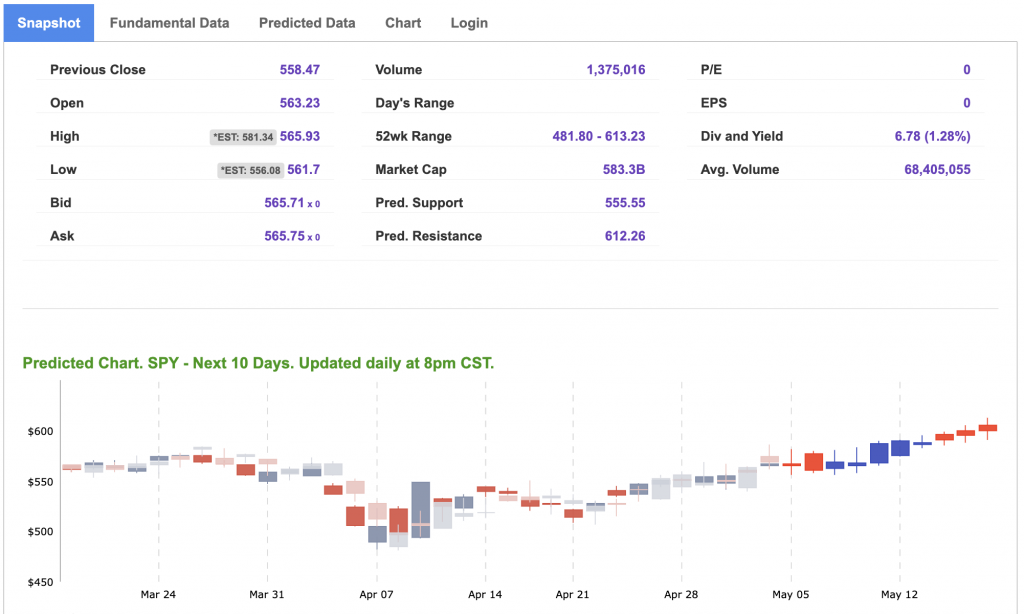
Using the “SPY” symbol to analyze the S&P 500, our 10-day prediction window shows a near-term positive outlook. Prediction data is uploaded after the market closes at 6 p.m. CST. Today’s data is based on market signals from the previous trading session.
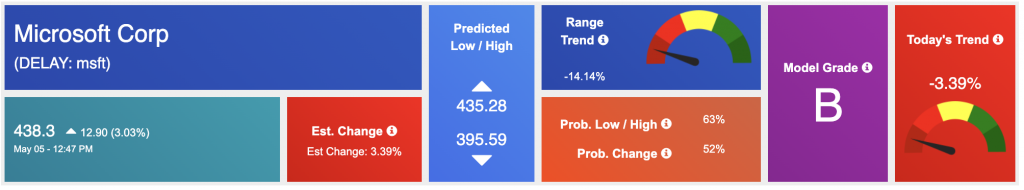
Our featured symbol for Tuesday is MSFT. Microsoft Corp. – MSFT is showing a steady vector in our Stock Forecast Toolbox’s 10-day forecast.
The symbol is trading at $438.3 with a vector of -3.39% at the time of publication.
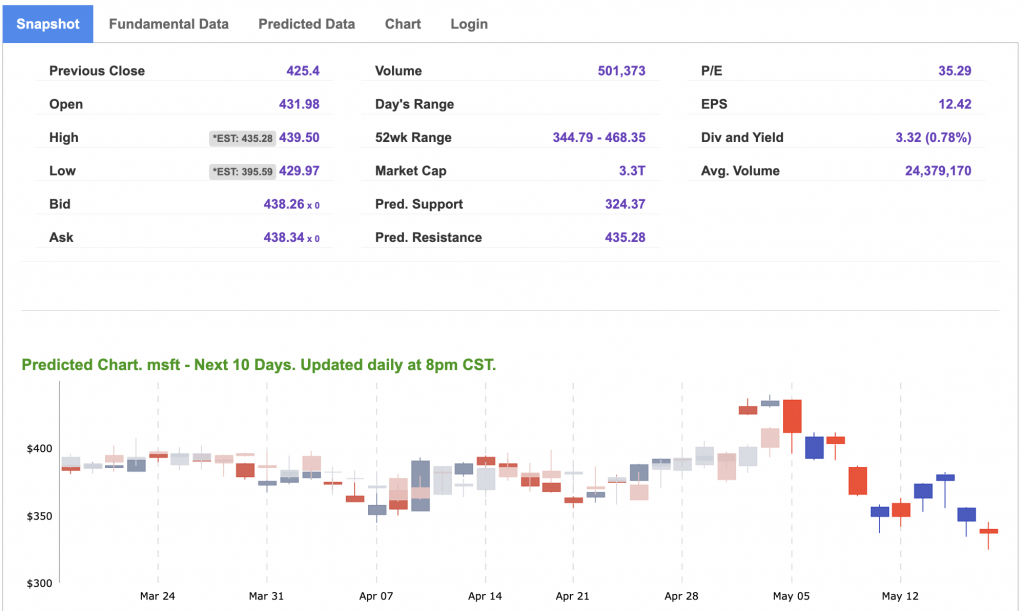
10-Day Prediction data is uploaded after the market close at 6 p.m., CST. Today’s data is based on market signals from the previous trading session.
Note: The Vector column calculates the change of the Forecasted Average Price for the next trading session relative to the average of actual prices for the last trading session. The column shows the expected average price movement “Up or Down”, in percent. Trend traders should trade along the predicted direction of the Vector. The higher the value of the Vector the higher its momentum.
*Please note: At the time of publication, Vlad Karpel does have a position in the featured symbol, PM. Our featured symbol is part of your free subscription service. It is not included in any paid Tradespoon subscription service. Vlad Karpel only trades his money in paid subscription services. If you are a paid subscriber, please review your Premium Member Picks, ActiveTrader, or MonthlyTrader recommendations. If you are interested in receiving Vlad’s picks, please click here.
West Texas Intermediate for Crude Oil delivery (CL.1) is priced at $57.21 per barrel, down 1.84%, at the time of publication.
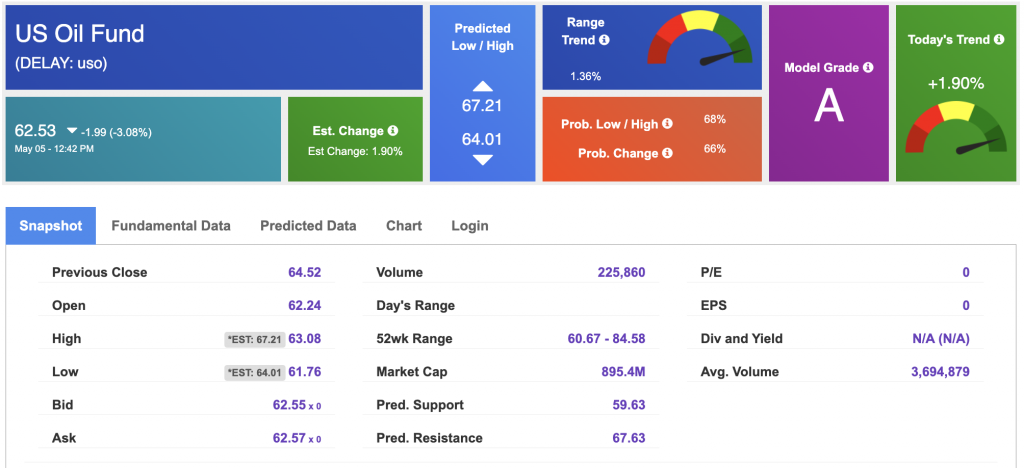
Looking at USO, a crude oil tracker, our 10-day prediction model shows mixed signals. The fund is trading at $62.53 at the time of publication. Prediction data is uploaded after the market close at 6 p.m., CST. Today’s data is based on market signals from the previous trading session.
The price for the Gold Continuous Contract (GC00) is up 2.49% at $3,324.10 at the time of publication.
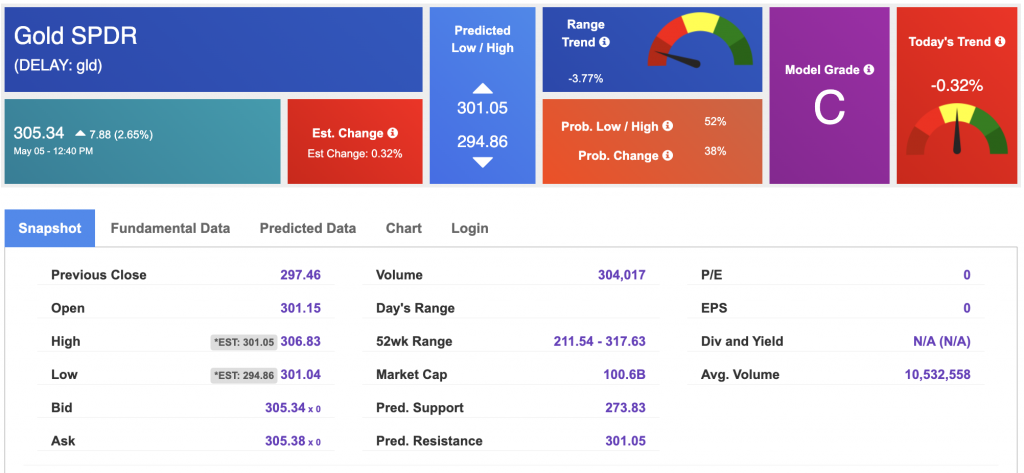
Using SPDR GOLD TRUST (GLD) as a tracker in our Stock Forecast Tool, the 10-day prediction window shows mixed signals. The gold proxy is trading at $305.34 at the time of publication. Vector signals show -0.32% for today. Prediction data is uploaded after the market close at 6 p.m., CST. Today’s data is based on market signals from the previous trading session.
The yield on the 10-year Treasury note is up at 4.369% at the time of publication.
The yield on the 30-year Treasury note is up at 4.855% at the time of publication.
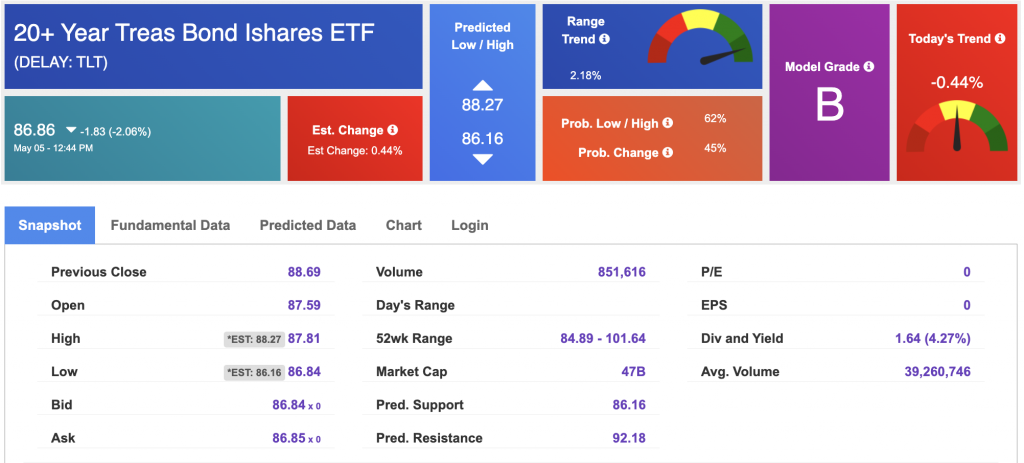
Using the iShares 20+ Year Treasury Bond ETF (TLT) as a proxy for bond prices in our Stock Forecast Tool, we see mixed signals in our 10-day prediction window. Prediction data is uploaded after the market close at 6 p.m., CST. Today’s data is based on market signals from the previous trading session.
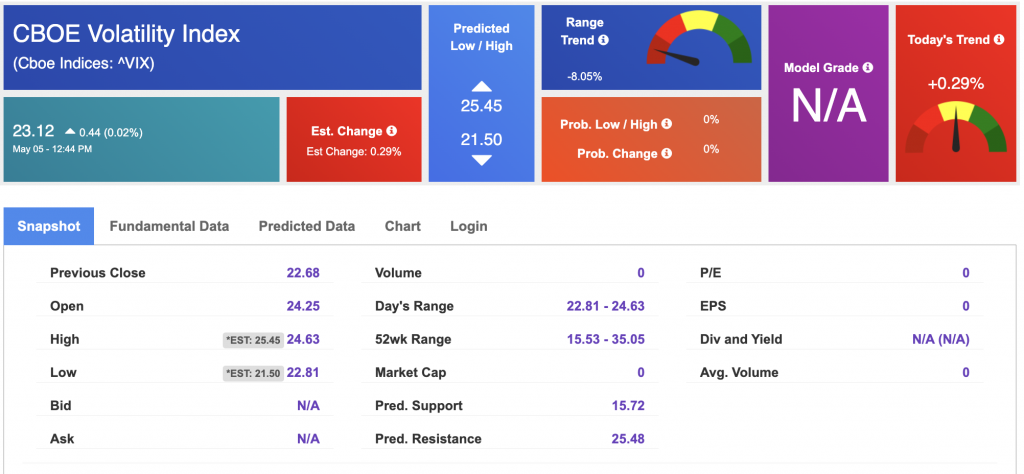
The CBOE Volatility Index (^VIX) is priced at $23.12 at the time of publication, and our 10-day prediction window shows mixed signals. Prediction data is uploaded after the market close at 6 p.m., CST. Today’s data is based on market signals from the previous trading session.
Please share this Tradespoon Market Commentary with your friends.
![]()

![]()
Comments Off on


Tradespoon Tools make finding winning trades in minute as easy as 1-2-3.
Our simple 3 step approach has resulted in an average return of almost 20% per trade!

