 Special Offer: Try the 'Tradespoon LIVE Membership' for ONLY $37!
CLICK HERE TO LEARN MORE
Special Offer: Try the 'Tradespoon LIVE Membership' for ONLY $37!
CLICK HERE TO LEARN MORE
Late last week, markets treaded a fine line. On Friday, July 25, fresh record highs in the S&P 500 and Nasdaq masked a lingering wariness. Recession odds were creeping up, rate cut expectations pushed into late 2025, and investors largely held a neutral stance—happy to observe rather than chase the rally. Beneath those milestones, volatility felt subdued: a watchful calm more than genuine conviction.
That calm broke Monday when traders greeted the U.S.–EU trade accord as a welcome dose of clarity. By capping new tariffs at 15% ahead of the August 1 deadline, the deal transformed what once would have sparked panic into a collective sigh of relief. Futures lifted instantly, and optimism rippled through boardrooms and trading floors alike, reinforcing that in today’s market, narrative often matters more than raw data.
This week’s backdrop was shaped by a pivotal Fed meeting and a parade of key data releases. On Wednesday, the Fed opted to hold rates steady, and Chair Powell struck a cautious tone: inflation remains elevated even as job growth shows signs of cooling.
Together, these mixed signals underscore why the Fed remains data-dependent and why rate cuts still feel distant.
June’s retail sales outperformed expectations, fueled by resilient consumer spending, and weekly jobless claims dipped below forecasts—reinforcing that the labor market isn’t collapsing even as hiring cools. However, tariff-driven import costs showed up in the 2.7% annual rise in June CPI, reminding investors that inflation remains sticky.
Meanwhile, Q2 earnings season offered a steady dose of reassurance:
Sector rotation told the week’s deeper story:
Treasury yields oscillated as well. The 10-year note traded in a wide 3.6%–4.8% range, dipping lower after softer jobs data. Markets weighed “higher for longer” rate expectations against eventual Fed easing. Speculation around a possible Fed leadership change under a Trump presidency added another layer of uncertainty.
This week’s momentum hinges on heavyweight reports:
These results will shape whether today’s cautious optimism can morph into sustained confidence.
Despite signs of resilience, we remain in a market-neutral posture:
Disciplined positioning—and attentiveness to both the data and the narratives driving them—will be essential as investors navigate what continues to feel like a high-wire act.
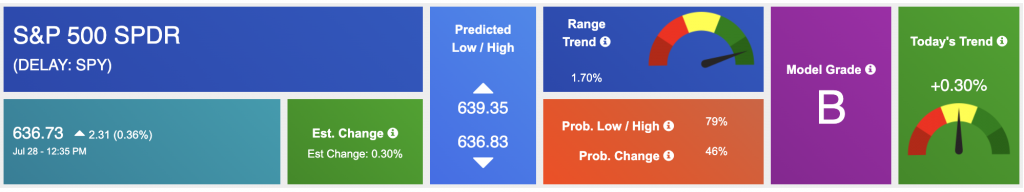
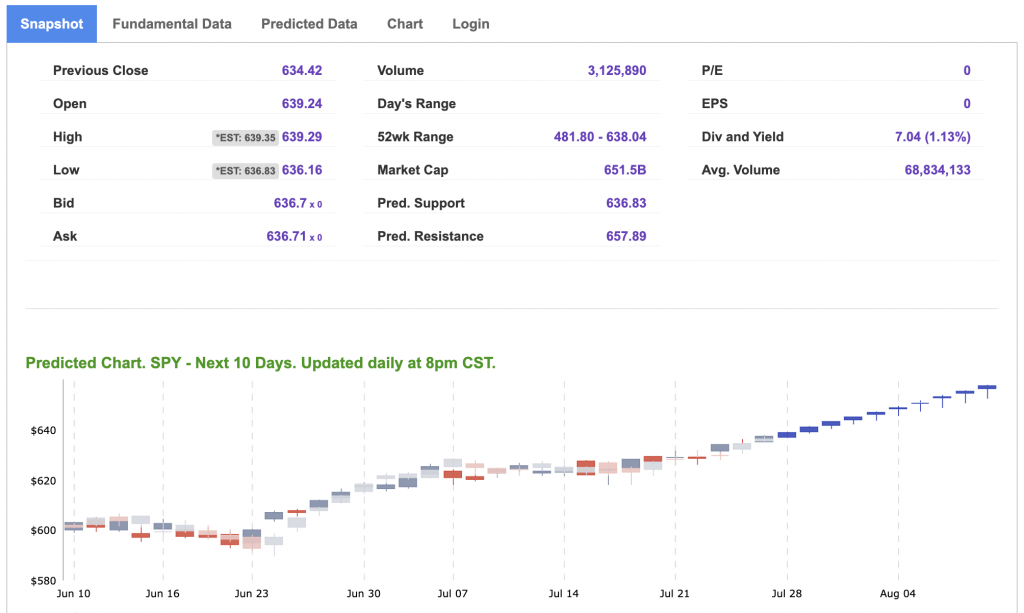
Using the “SPY” symbol to analyze the S&P 500, our 10-day prediction window shows a near-term positive outlook. Prediction data is uploaded after the market closes at 6 p.m. CST. Today’s data is based on market signals from the previous trading session.
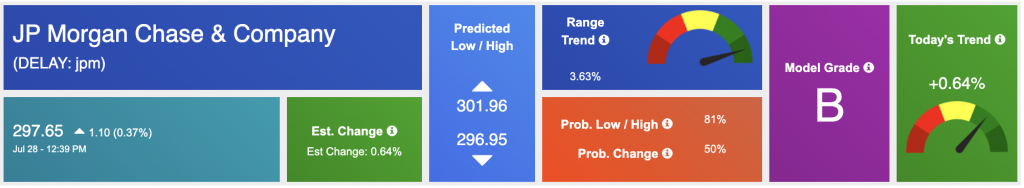
Our featured symbol for Tuesday is JPM. JP Morgan Chase & Company – JPM is showing a steady vector in our Stock Forecast Toolbox’s 10-day forecast.
The symbol is trading at $297.65 with a vector of +0.64% at the time of publication.
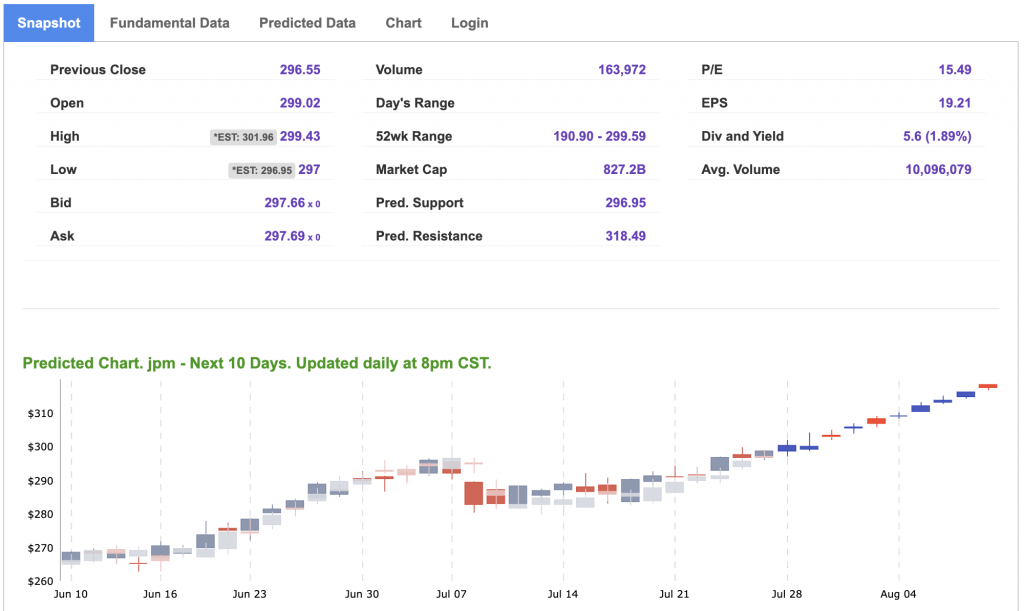
10-Day Prediction data is uploaded after the market close at 6 p.m., CST. Today’s data is based on market signals from the previous trading session.
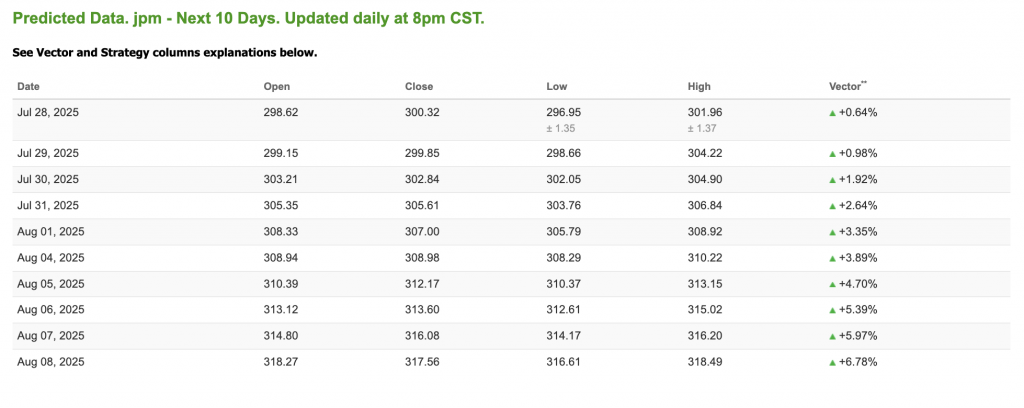
Note: The Vector column calculates the change of the Forecasted Average Price for the next trading session relative to the average of actual prices for the last trading session. The column shows the expected average price movement “Up or Down”, in percent. Trend traders should trade along the predicted direction of the Vector. The higher the value of the Vector the higher its momentum.
*Please note: At the time of publication, Vlad Karpel does have a position in the featured symbol, JPM. Our featured symbol is part of your free subscription service. It is not included in any paid Tradespoon subscription service. Vlad Karpel only trades his money in paid subscription services. If you are a paid subscriber, please review your Premium Member Picks, ActiveTrader, or MonthlyTrader recommendations. If you are interested in receiving Vlad’s picks, please click here.
West Texas Intermediate for Crude Oil delivery (CL.1) is priced at $66.60 per barrel, UP 2.23%, at the time of publication.
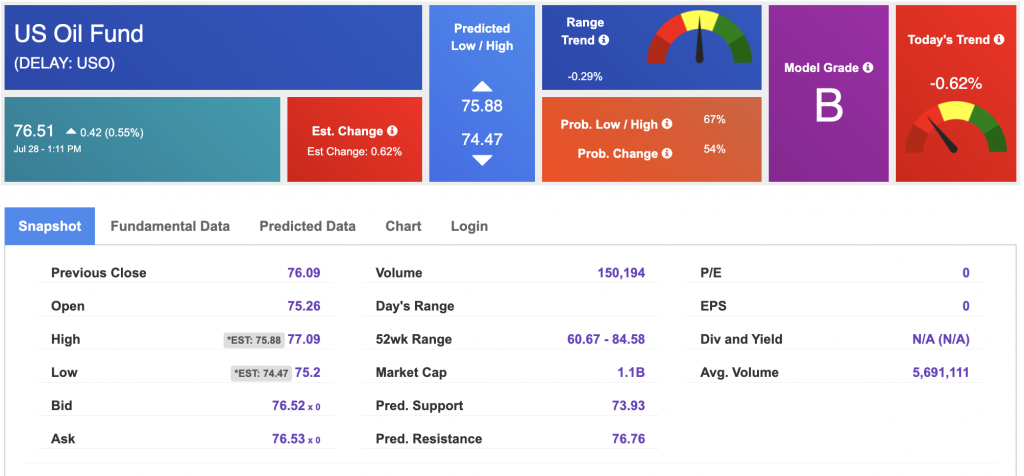
Looking at USO, a crude oil tracker, our 10-day prediction model shows mixed signals. The fund is trading at $76.51 at the time of publication. Prediction data is uploaded after the market close at 6 p.m., CST. Today’s data is based on market signals from the previous trading session.
The price for the Gold Continuous Contract (GC00) is DOWN 0.73% at $3,331.20 at the time of publication.
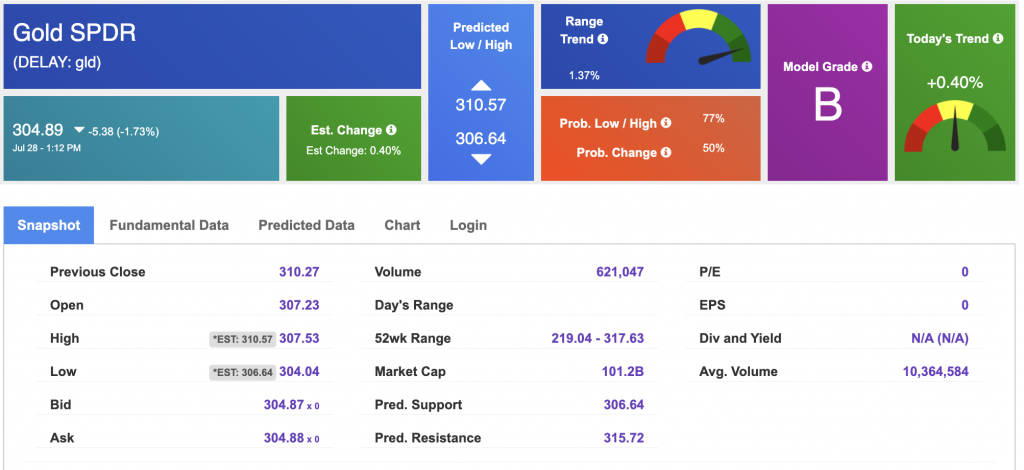
Using SPDR GOLD TRUST (GLD) as a tracker in our Stock Forecast Tool, the 10-day prediction window shows mixed signals. The gold proxy is trading at $304.89 at the time of publication. Vector signals show +0.40% for today. Prediction data is uploaded after the market close at 6 p.m., CST. Today’s data is based on market signals from the previous trading session.
The yield on the 10-year Treasury note is up at 4.414% at the time of publication.
The yield on the 30-year Treasury note is up at 4.961% at the time of publication.
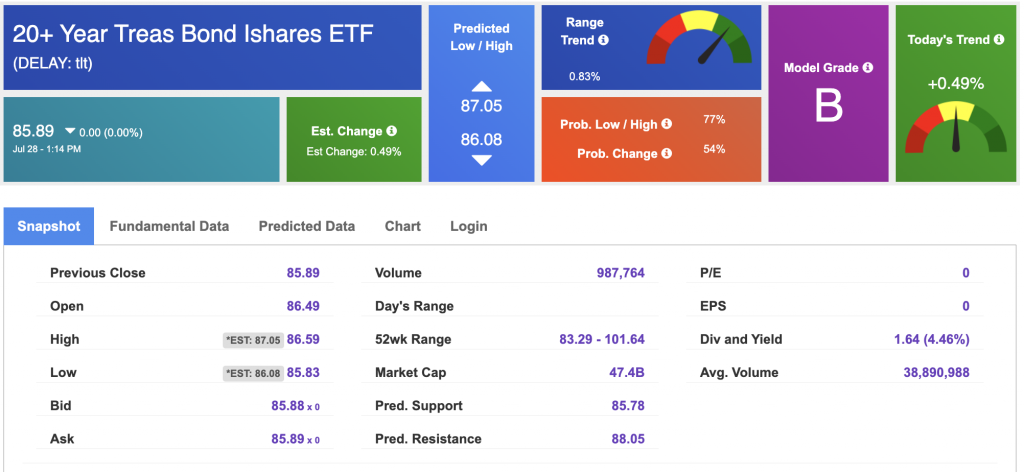
Using the iShares 20+ Year Treasury Bond ETF (TLT) as a proxy for bond prices in our Stock Forecast Tool, we see mixed signals in our 10-day prediction window. Prediction data is uploaded after the market close at 6 p.m., CST. Today’s data is based on market signals from the previous trading session.
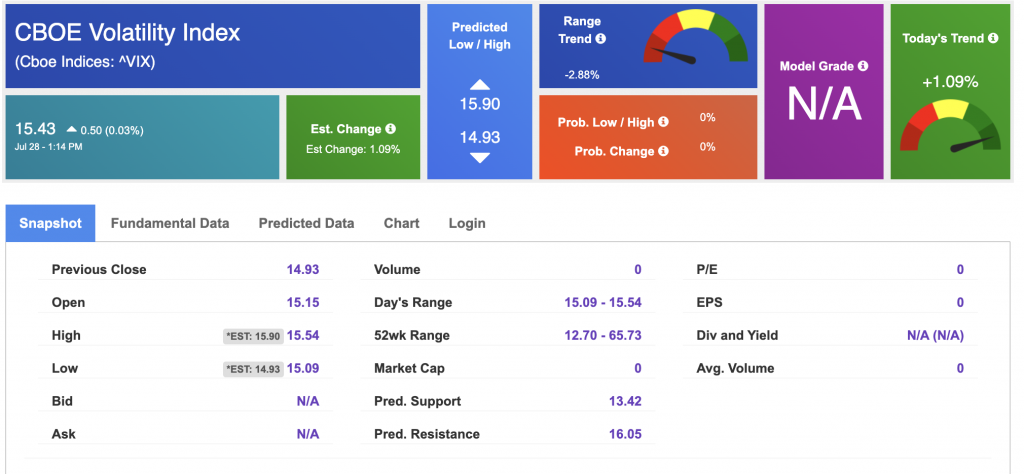
The CBOE Volatility Index (^VIX) is priced at $15.43 at the time of publication, and our 10-day prediction window shows mixed signals. Prediction data is uploaded after the market close at 6 p.m., CST. Today’s data is based on market signals from the previous trading session.
Please share this Tradespoon Market Commentary with your friends.
![]()

![]()
Comments Off on


Tradespoon Tools make finding winning trades in minute as easy as 1-2-3.
Our simple 3 step approach has resulted in an average return of almost 20% per trade!

