 Special Offer: Try the 'Elite Trading Circle Membership' for ONLY $37!
CLICK HERE TO LEARN MORE
Special Offer: Try the 'Elite Trading Circle Membership' for ONLY $37!
CLICK HERE TO LEARN MORE
Date: August 14, 2023
Stocks exhibited a varied performance on Monday, retracing some of the gains witnessed during last week’s surge, prompted by indications of abating inflation in the U.S. labor report. This week’s trading kicked off with a blend of upward and downward movements as investors navigated the aftermath of Friday’s robust rally. As the new trading week begins, market participants are bracing themselves for a series of impactful events, including the unveiling of U.S. inflation figures and the inauguration of the fourth-quarter earnings season.
Last Friday’s upbeat job report numbers from the U.S. have played a pivotal role in driving the recent market surge. Investors are increasingly hopeful about a “soft landing,” envisaging that the Federal Reserve will effectively manage inflation without precipitating a significant economic slowdown.
This week promises to paint a clearer picture of the inflationary and economic landscape, with a highlight being the forthcoming speech by Federal Reserve Chairman Jerome Powell scheduled for Tuesday. The eagerly awaited U.S. consumer-price index is set to be revealed on Thursday, a data point that traditionally influences stock market movements due to its reflection of consumer-level inflation.
While the most impactful market triggers are anticipated later in the week, Monday boasts its own set of economic revelations. Notably, the New York Federal Reserve’s one-year and five-year inflation expectations are expected to garner attention, with investors seeking signs of decreasing figures. Additionally, insights from speeches by Atlanta Federal Reserve President Raphael Bostic and San Francisco Federal Reserve President Mary Daly will be monitored closely.
As the earnings season approaches its conclusion, this week’s earnings calendar includes notable names such as Home Depot, Walmart, Applied Materials, Cardinal Health, Cisco Systems, Wynn Resorts, and Deere. These releases are expected to provide further insights into the corporate landscape and potential market shifts.
In the bond market, Treasury debt prices experienced an ascent on Monday, causing yields to retreat. By early afternoon, the yield on the 10-year note stood at approximately 3.52%, a decline from Friday’s close at 3.57%. Notably, the yield had briefly reached an even lower level of around 3.51% during earlier trading hours.
Oil prices were on an upward trajectory on Monday, driven by China’s decision to reopen its borders for travel after a three-year hiatus due to its revised Covid-19 policy. Brent crude, the internationally recognized benchmark, saw a 2.9% uptick, reaching $80.83 per barrel. Simultaneously, West Texas Intermediate, the U.S. standard, experienced a comparable 2.9% increase, reaching $75.94 per barrel. Both contracts rebounded from last week’s substantial 8% decline.
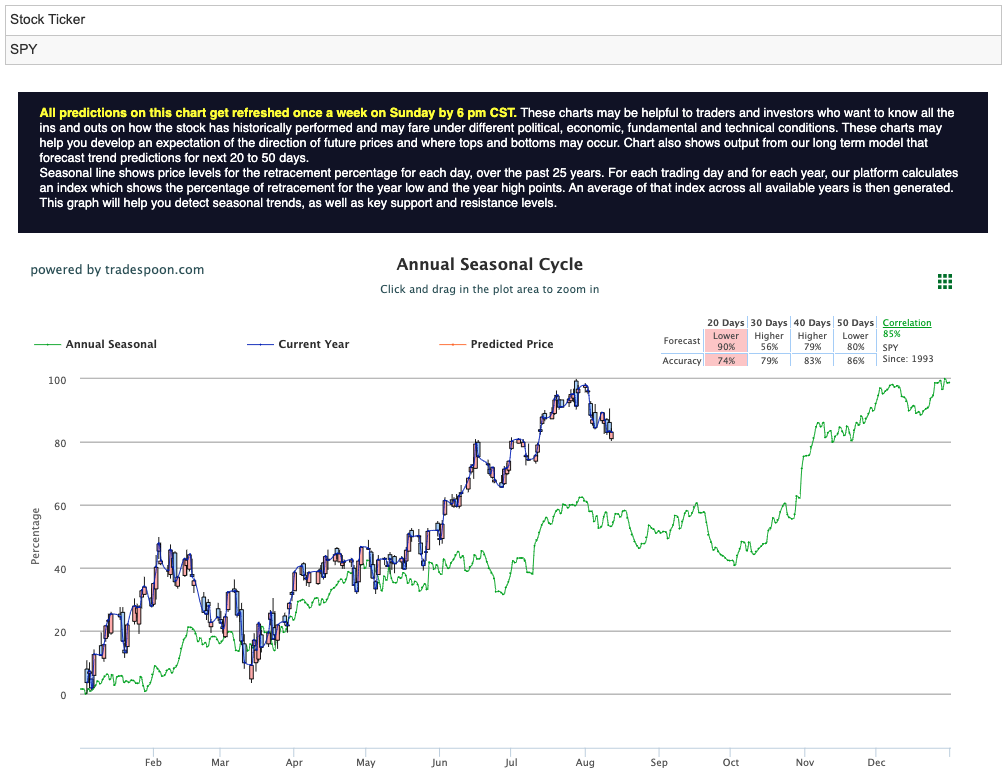
Amidst an economic landscape characterized by reduced recession probabilities and a declining U.S. Dollar Index ($DXY), market experts are cautiously optimistic about the future trajectory. Following a sentiment shift during the mid-summer period, expectations of heightened market volatility persist as the year progresses. While maintaining an optimistic stance, analysts project a potential upper boundary for a SPY rally ranging from $450 to $470. Moreover, they pinpoint short-term support levels within the 400-430 range in the coming months. Market commentary readers should maintain clearly defined stop levels for all positions. For reference, the SPY Seasonal Chart is shown below:
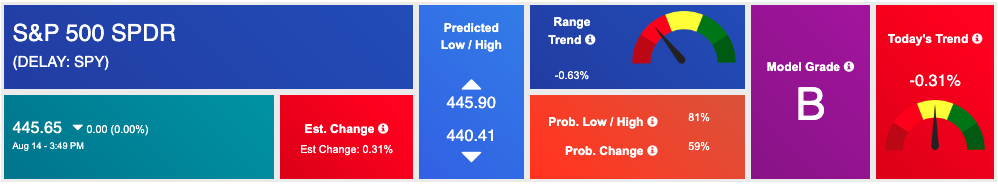
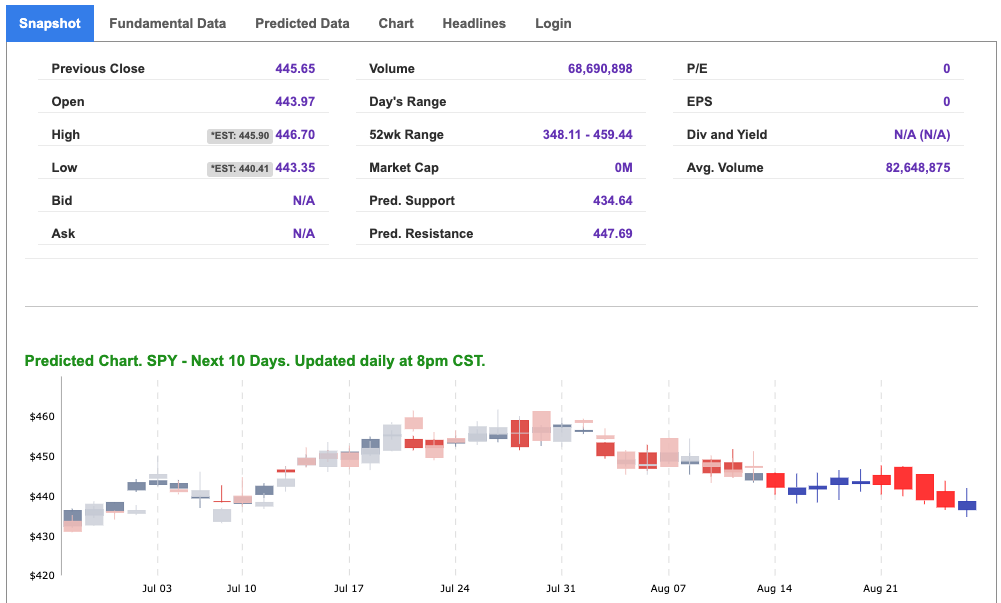
Using the “SPY” symbol to analyze the S&P 500 our 10-day prediction window shows a near-term positive outlook. Prediction data is uploaded after the market closes at 6 p.m. CST. Today’s data is based on market signals from the previous trading session.
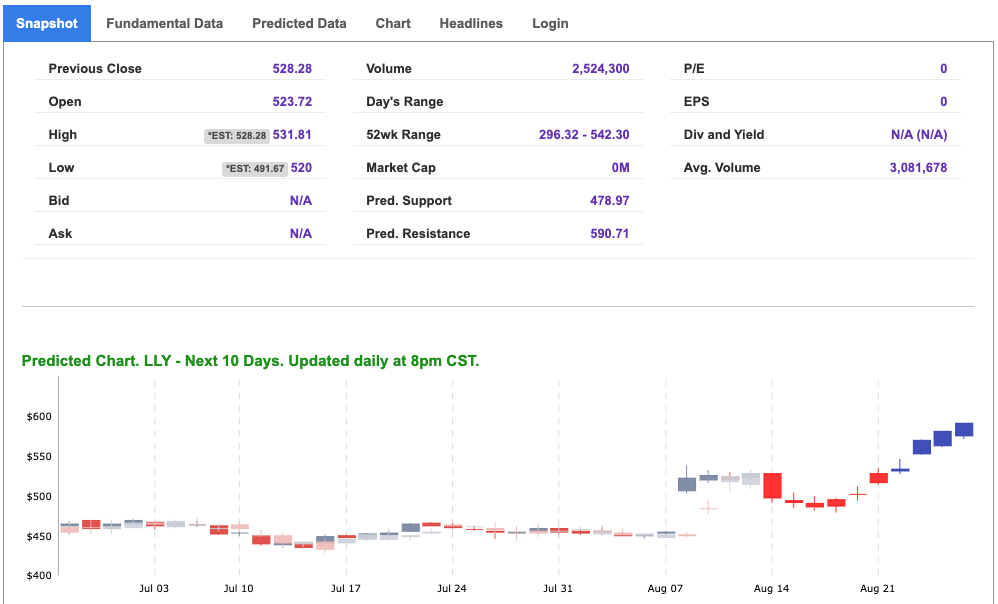
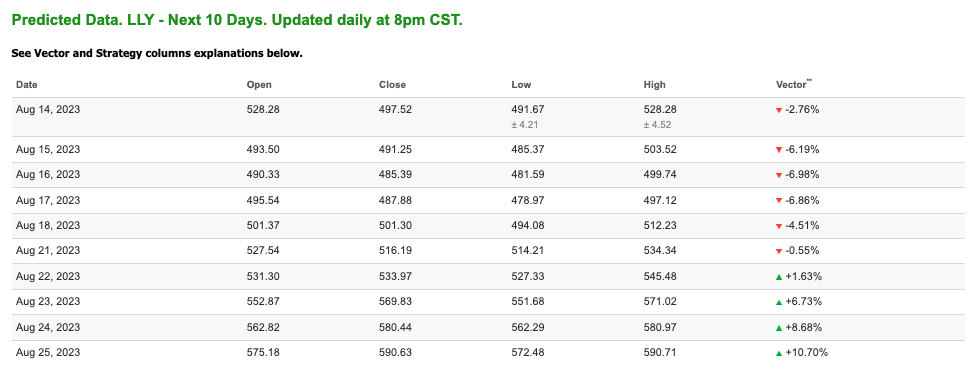
Note: The Vector column calculates the change of the Forecasted Average Price for the next trading session relative to the average of actual prices for the last trading session. The column shows the expected average price movement “Up or Down”, in percent. Trend traders should trade along the predicted direction of the Vector. The higher the value of the Vector the higher its momentum.
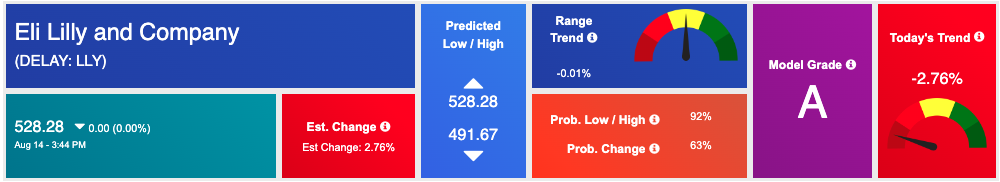
*Please note: At the time of publication Vlad Karpel does NOT have a position in the featured symbol, LLY. Our featured symbol is part of your free subscription service. It is not included in any paid Tradespoon subscription service. Vlad Karpel only trades his money in paid subscription services. If you are a paid subscriber, please review your Premium Member Picks, ActiveTrader, or MonthlyTrader recommendations. If you are interested in receiving Vlad’s picks, please click here.
West Texas Intermediate for Crude Oil delivery (CL.1) is priced at $82.49 per barrel, down 0.84%, at the time of publication.
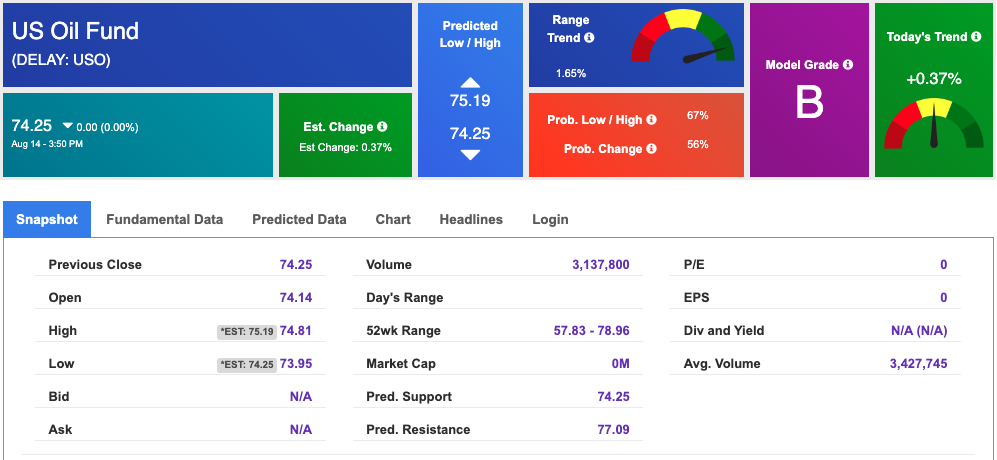
Looking at USO, a crude oil tracker, our 10-day prediction model shows mixed signals. The fund is trading at $74.25 at the time of publication. Prediction data is uploaded after the market close at 6 p.m., CST. Today’s data is based on market signals from the previous trading session.
The price for the Gold Continuous Contract (GC00) is down 0.37% at $1939.40 at the time of publication.
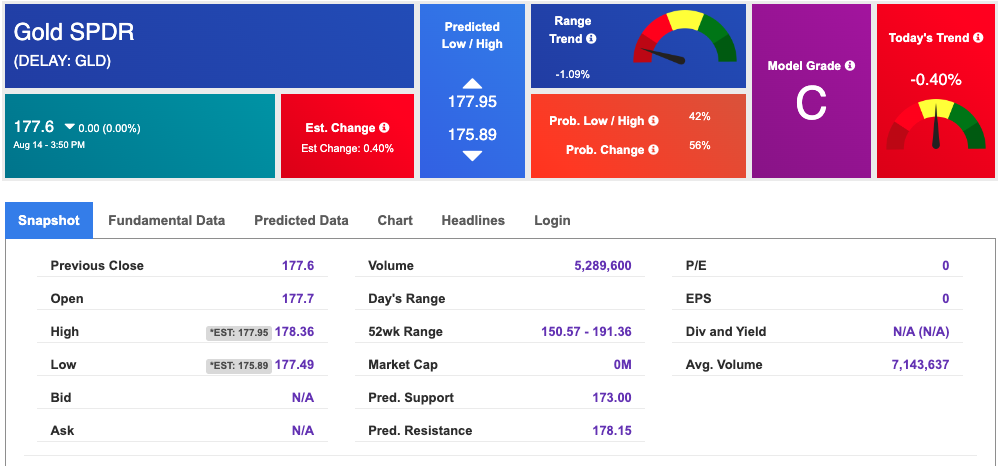
Using SPDR GOLD TRUST (GLD) as a tracker in our Stock Forecast Tool, the 10-day prediction window shows mixed signals. The gold proxy is trading at $177.6 at the time of publication. Vector signals show -0.40% for today. Prediction data is uploaded after the market close at 6 p.m., CST. Today’s data is based on market signals from the previous trading session.
The yield on the 10-year Treasury note is up at 4.195% at the time of publication.
The yield on the 30-year Treasury note is up at 4.290% at the time of publication.
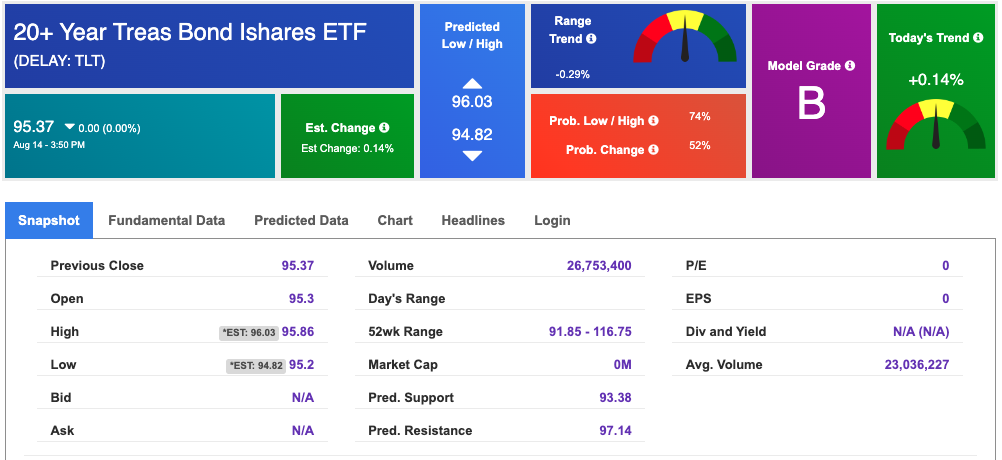
Using the iShares 20+ Year Treasury Bond ETF (TLT) as a proxy for bond prices in our Stock Forecast Tool, we see mixed signals in our 10-day prediction window. Prediction data is uploaded after the market close at 6 p.m., CST. Today’s data is based on market signals from the previous trading session.
The CBOE Volatility Index (^VIX) is priced at $14.82, down 0.13% at the time of publication, and our 10-day prediction window shows mixed signals. Prediction data is uploaded after the market close at 6 p.m., CST. Today’s data is based on market signals from the previous trading session.
Please share this Tradespoon Market Commentary with your friends.
![]()

![]()
Comments Off on


Tradespoon Tools make finding winning trades in minute as easy as 1-2-3.
Our simple 3 step approach has resulted in an average return of almost 20% per trade!

