 Special Offer: Try the 'ShadowTrader Membership' for ONLY $37!
CLICK HERE TO LEARN MORE
Special Offer: Try the 'ShadowTrader Membership' for ONLY $37!
CLICK HERE TO LEARN MORE
Stocks continue to ride an uneasy wave of optimism, balancing AI-fueled strength in megacap tech against mounting signs of economic strain. The Nasdaq and S&P 500 both set fresh record highs on Monday, extending last week’s momentum, while the Dow remained more subdued under the weight of staples and health care weakness. Beneath the surface, narrow breadth and fragile fundamentals are raising questions about just how much longer this rally can sustain before the Federal Reserve takes center stage.
The prior week laid the groundwork for this move. A weak August jobs report showed only 22,000 payroll additions with unemployment ticking up to 4.3%, reinforcing concerns about a slowing labor market. Inflation data added complexity: CPI held at 2.9% year-over-year, core at 3.1%, while producer prices slipped unexpectedly, hinting at easing pressures on the supply side. Together, the data framed a mild stagflation backdrop—sluggish growth and sticky inflation—that left investors betting heavily on a rate cut at the upcoming Fed meeting. Treasury yields whipsawed in response, with the 10-year dropping near 4.08% midweek before rising again into Friday.
Corporate news only heightened the divergence between tech resilience and broader market softness. Alphabet surged after a favorable antitrust ruling, Broadcom stunned with $10 billion in new AI chip orders, and Oracle and Nvidia carried the Nasdaq to repeated records. Yet industrials and consumer staples lagged, weighed down by tariff uncertainty following a federal appeals court ruling that cast doubt on much of the Trump-era trade structure but left tariffs in place for now.
Monday extended the same theme. The so-called “Mag 7” — Tesla, Meta, Alphabet, Amazon, Microsoft, Apple, and Nvidia — once again did most of the heavy lifting, pushing the Nasdaq up nearly 0.8% and the S&P 500 higher by 0.4% for new closing highs. Breadth, however, was negative, with only a handful of sectors advancing. Consumer staples and health care both fell close to 1%, explaining why the Dow lagged despite coming close to its recent highs. Risk appetite clearly returned, with growth and momentum ETFs outperforming while value and low-volatility plays struggled.
Trade developments also influenced sentiment. U.S. and Chinese negotiators announced a framework agreement to place TikTok in American ownership, potentially averting a ban of the app used by 170 million Americans. While the deal remains subject to signoff by Presidents Trump and Xi later this week, the move signaled modest progress in an otherwise tense economic relationship. Export controls and tariffs remain unresolved, ensuring trade will stay a headline risk for markets.
Commodities added another layer. Gold surged to a new record above $3,700 an ounce as investors braced for a likely rate cut—the first since December—and sought safe havens ahead of the Fed’s updated projections. Oil rebounded after last week’s geopolitical escalations in Eastern Europe, and IPO activity continued at a brisk pace, with Klarna, Bullish Group, and Miami International Holdings highlighting renewed market appetite for new listings.
All eyes now turn to the Federal Reserve. Futures markets fully price in a quarter-point cut on Wednesday, with only slim odds assigned to a larger half-point move. The updated dot plot and commentary on the labor market will be critical for gauging whether this is the beginning of a cutting cycle or a one-off adjustment. With indexes stretched at record levels and much of the rally built on anticipation of easier policy, the risk of a “sell the news” reaction looms large.
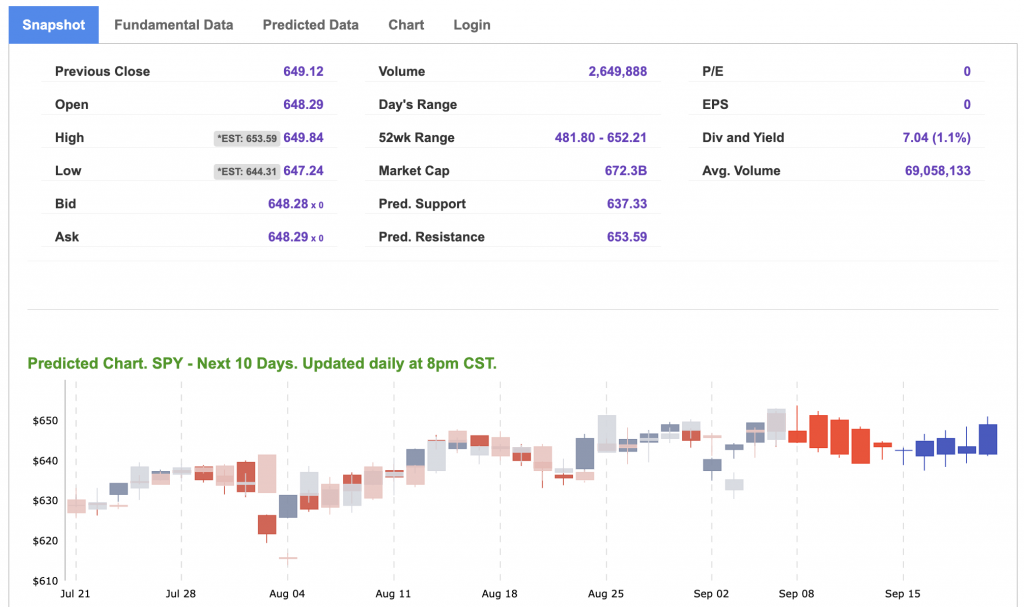
My outlook remains market-neutral. For SPY, I continue to see near-term upside toward 650–660, with strong support in the 600–620 zone. Yet the bigger picture remains fragile: unemployment is climbing, growth is slowing, and inflation is proving stubborn. Until the Fed clarifies its stance and the labor picture stabilizes, volatility may be lurking just below the calm surface.
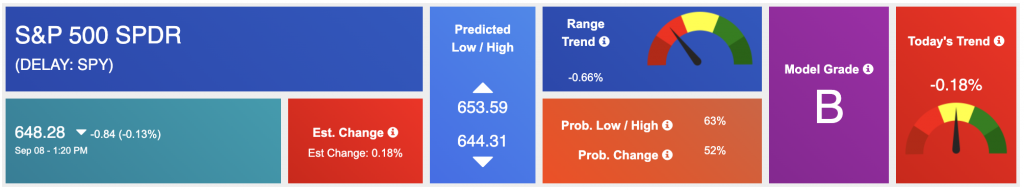
Using the “SPY” symbol to analyze the S&P 500, our 10-day prediction window shows a near-term positive outlook. Prediction data is uploaded after the market closes at 6 p.m. CST. Today’s data is based on market signals from the previous trading session.
Our featured symbol for Tuesday is GOOGL. Alphabet is showing a steady vector in our Stock Forecast Toolbox’s 10-day forecast.
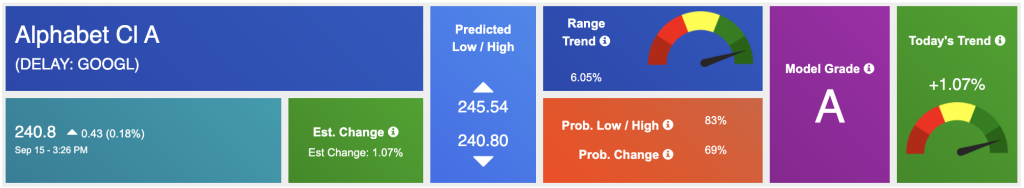
The symbol is trading at $240.8 with a vector of +1.07% at the time of publication.
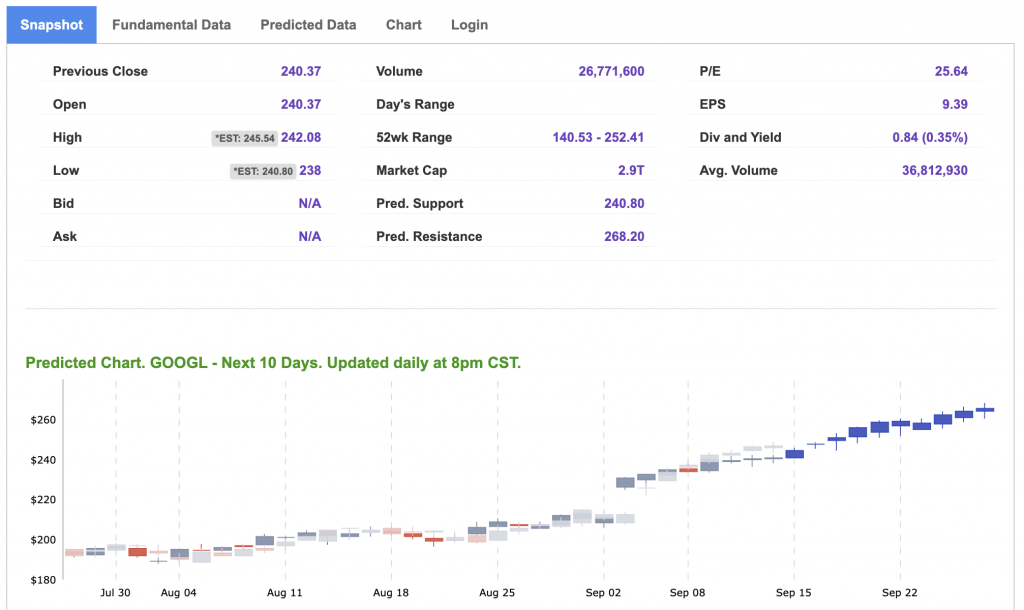
10-Day Prediction data is uploaded after the market close at 6 p.m., CST. Today’s data is based on market signals from the previous trading session.
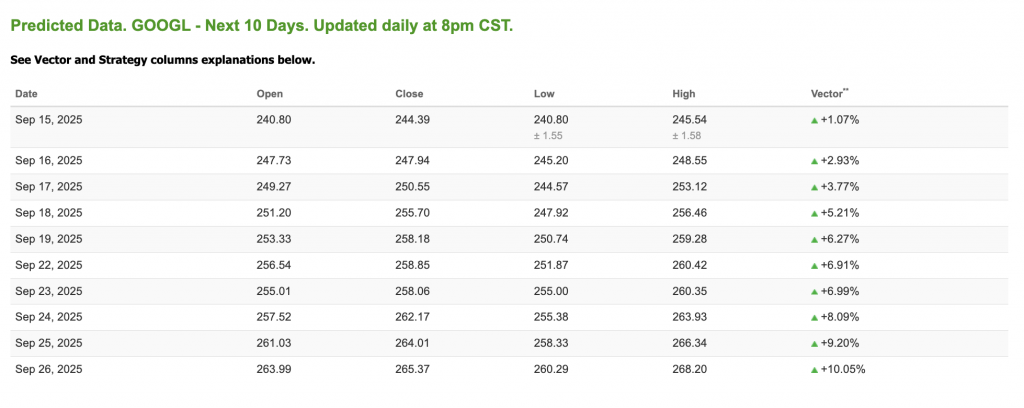
Note: The Vector column calculates the change of the Forecasted Average Price for the next trading session relative to the average of actual prices for the last trading session. The column shows the expected average price movement “Up or Down”, in percent. Trend traders should trade along the predicted direction of the Vector. The higher the value of the Vector the higher its momentum.
*Please note: At the time of publication, Vlad Karpel does have a position in the featured symbol, GOOGL. Our featured symbol is part of your free subscription service. It is not included in any paid Tradespoon subscription service. Vlad Karpel only trades his money in paid subscription services. If you are a paid subscriber, please review your Premium Member Picks, ActiveTrader, or MonthlyTrader recommendations. If you are interested in receiving Vlad’s picks, please click here.
West Texas Intermediate for Crude Oil delivery (CL.1) is priced at $63.26 per barrel, up 0.91%, at the time of publication.
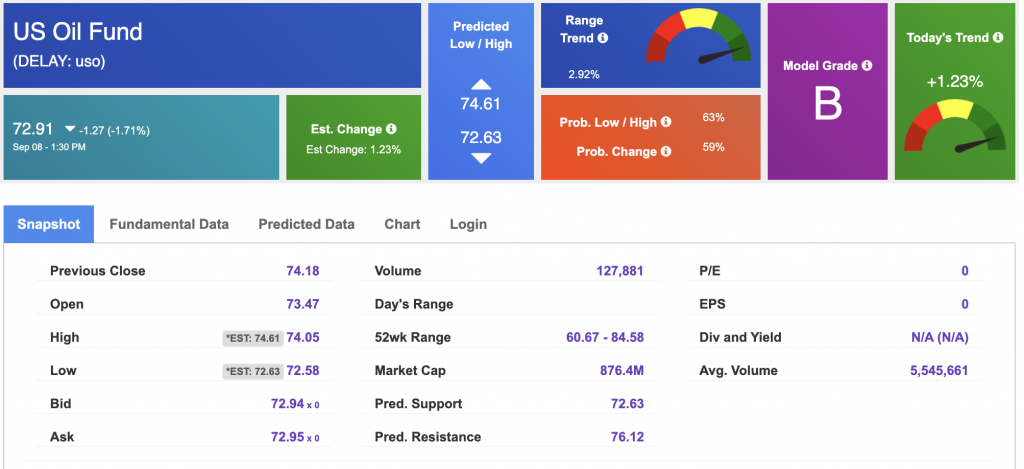
Looking at USO, a crude oil tracker, our 10-day prediction model shows mixed signals. The fund is trading at $72.91 at the time of publication. Prediction data is uploaded after the market close at 6 p.m., CST. Today’s data is based on market signals from the previous trading session.
The price for the Gold Continuous Contract (GC00) is up 0.89% at $3,719.00 at the time of publication.
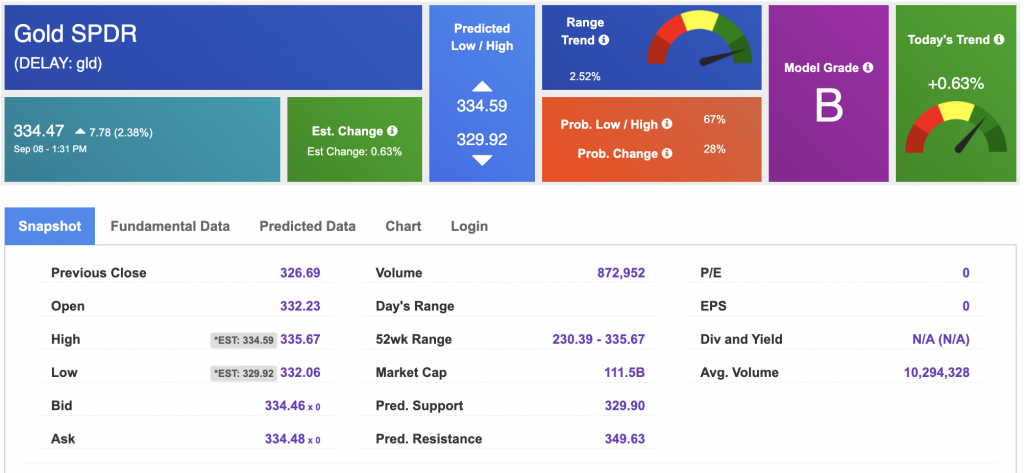
Using SPDR GOLD TRUST (GLD) as a tracker in our Stock Forecast Tool, the 10-day prediction window shows mixed signals. The gold proxy is trading at $334.47 at the time of publication. Vector signals show +0.63% for today. Prediction data is uploaded after the market close at 6 p.m., CST. Today’s data is based on market signals from the previous trading session.
The yield on the 10-year Treasury note is down at 4.044% at the time of publication.
The yield on the 30-year Treasury note is down at 4.663% at the time of publication.
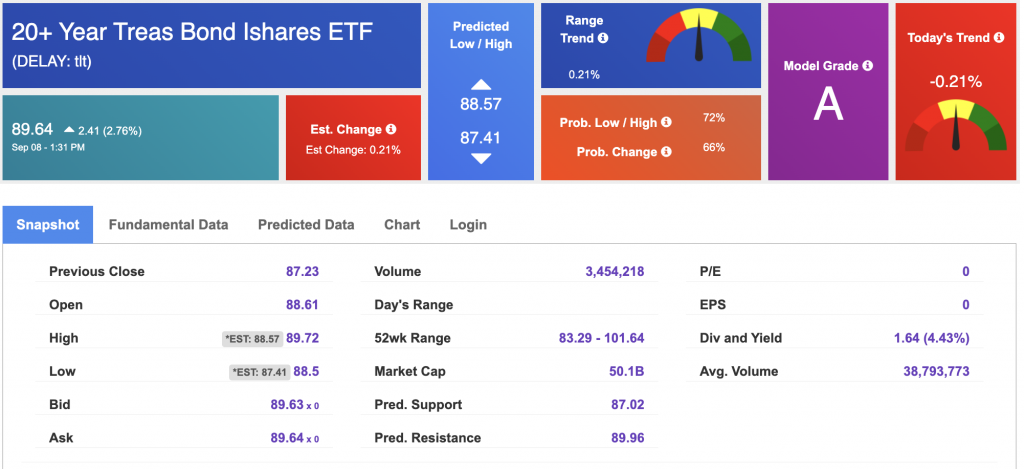
Using the iShares 20+ Year Treasury Bond ETF (TLT) as a proxy for bond prices in our Stock Forecast Tool, we see mixed signals in our 10-day prediction window. Prediction data is uploaded after the market close at 6 p.m., CST. Today’s data is based on market signals from the previous trading session.
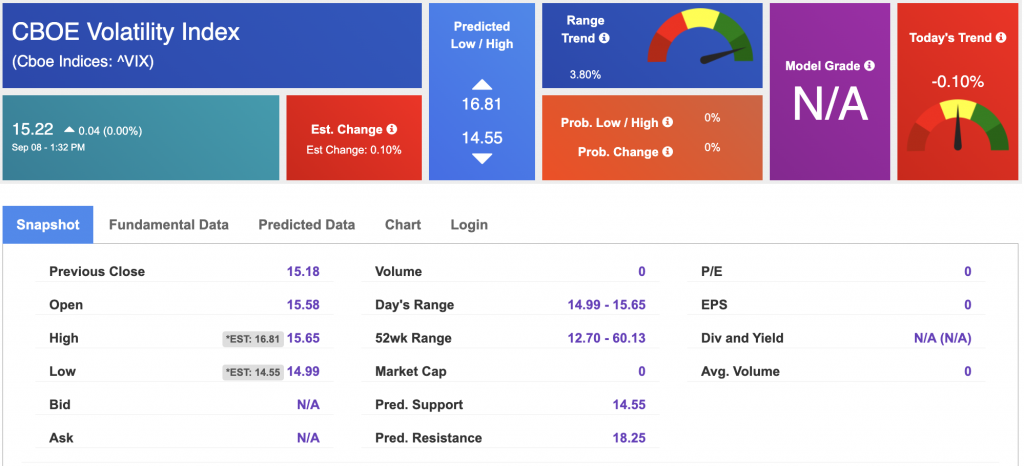
The CBOE Volatility Index (^VIX) is priced at $15.22 at the time of publication, and our 10-day prediction window shows mixed signals. Prediction data is uploaded after the market close at 6 p.m., CST. Today’s data is based on market signals from the previous trading session.
Please share this Tradespoon Market Commentary with your friends.
![]()

![]()
Comments Off on


Tradespoon Tools make finding winning trades in minute as easy as 1-2-3.
Our simple 3 step approach has resulted in an average return of almost 20% per trade!

