 Are you a Long-Term Trader? Then take a look at our NEW RoboInvestor Service?
CLICK HERE TO LEARN MORE
Are you a Long-Term Trader? Then take a look at our NEW RoboInvestor Service?
CLICK HERE TO LEARN MORE
As the second quarter commences, the financial landscape brims with volatility, setting the tone for investors. The opening day of April witnessed major indexes grappling with uncertainty, with the Dow Jones Industrial Average dipping after flirting with the elusive 40,000 mark. Simultaneously, the S&P 500 and Nasdaq Composite relinquished early gains, adding to the market’s intrigue. A notable uptick in the benchmark 10-year U.S. Treasury note yield to 4.31% further fueled the apprehension.
The spotlight shines on the Federal Reserve Bank of Atlanta, which significantly raised its first-quarter economic growth forecast, echoing a renewed sense of optimism. The Atlanta Fed’s GDPNow model, known for its responsiveness to real-time data, now projects a robust 2.8% increase in gross domestic product, outstripping earlier estimates. This upward revision, surpassing initial predictions by a substantial margin, signals a potential delay in anticipated interest-rate cuts, prompting concerns about escalating bond yields and their implications for equities. The Federal Reserve, maintaining its stance from the March meeting, still eyes three rate cuts this year.
Last week, all eyes were on the release of the Personal Consumption Expenditures (PCE) data, a pivotal gauge of inflation’s sway over market sentiment and interest rate expectations. The unveiling of the core PCE index by the Bureau of Economic Analysis offered a nuanced insight into inflationary trends. February’s core PCE index edged up by 0.3%, mirroring economists’ projections, albeit indicating a slight slowdown from the previous month. Notably, the year-over-year rise of 2.8% underscores a sustained upward trajectory, providing policymakers and market participants with critical information to assess the economy’s resilience and inflation’s course.
The market’s response to the PCE data was multifaceted, with the U.S. Dollar Index experiencing a modest decline, hinting at expectations of subdued interest rates. Concurrently, the retreat in the 10-year Treasury yield ignited discussions on the normalization of the yield curve, a topic of keen interest among investors and analysts.
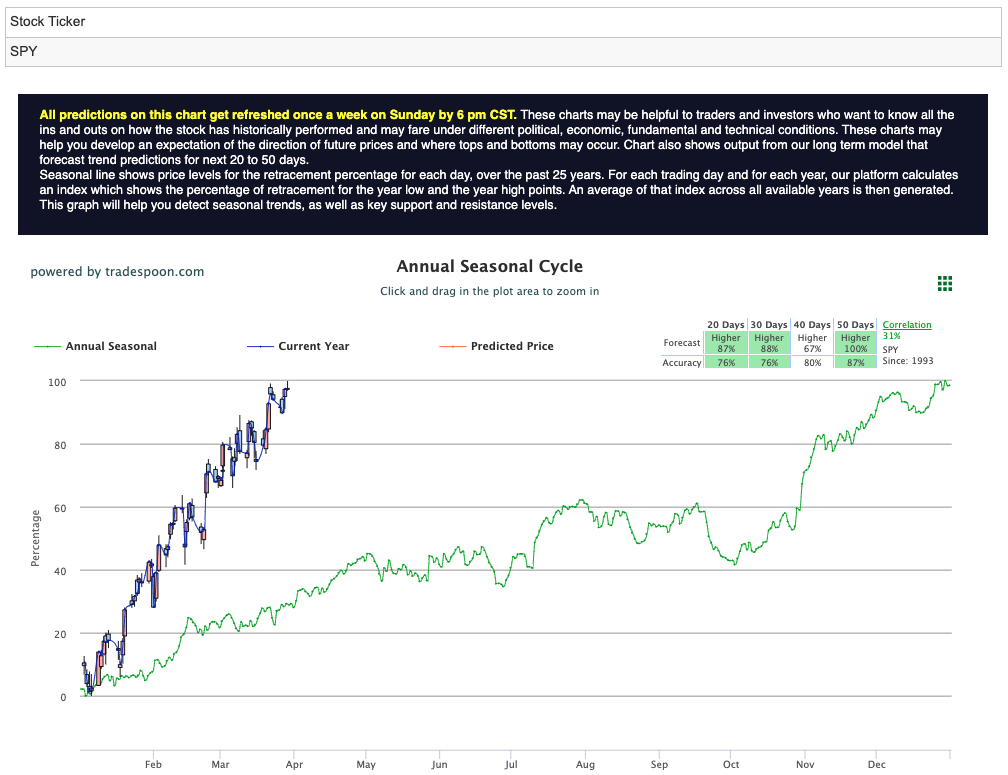
Navigating through this intricate landscape, market analysts maintain a cautious yet optimistic outlook, meticulously monitoring key support and resistance levels for major indices. The SPY rally faces potential hurdles within the $510-525 range, with short-term support pegged at $480-490, presenting a delicate balancing act for investors. For reference, the SPY Seasonal Chart is shown below:
Looking ahead, the week promises a cascade of significant events, including the ADP Employment report and ISM Services data slated for Wednesday. Moreover, multiple Federal Reserve officials’ comments throughout the week, coupled with Friday’s release of substantial employment data, will add depth to market dynamics. As investors navigate through these developments, the evolving economic narrative continues to shape market sentiment, demanding astute navigation and adaptive strategies.
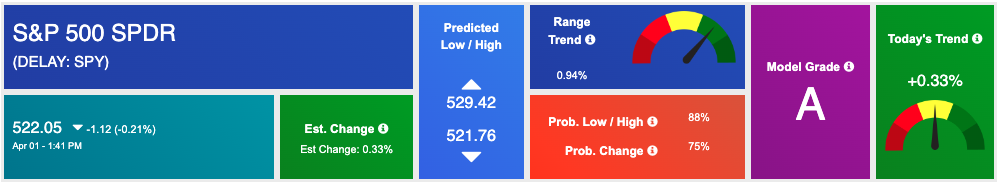
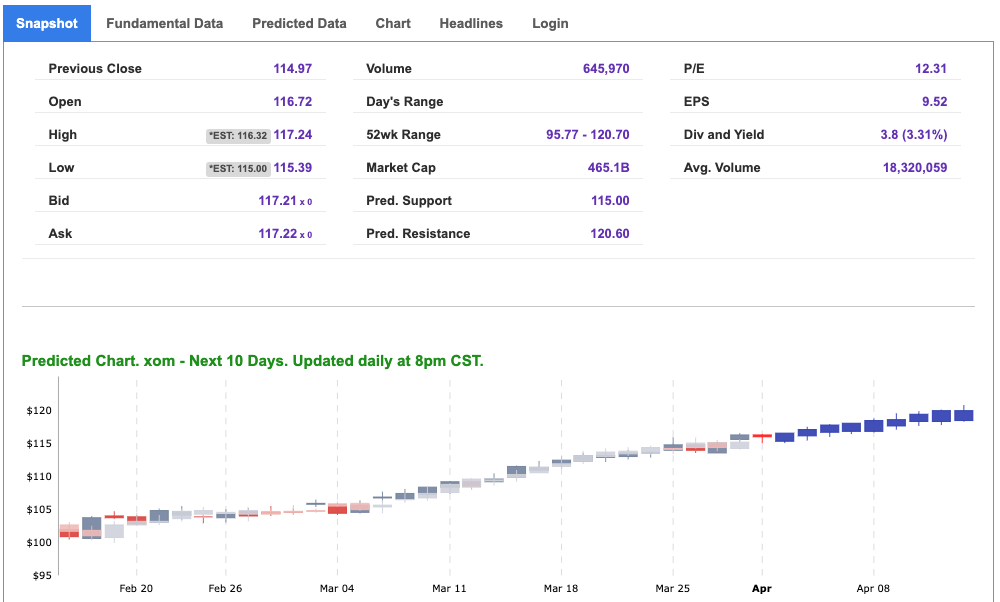
Using the “SPY” symbol to analyze the S&P 500 our 10-day prediction window shows a near-term positive outlook. Prediction data is uploaded after the market closes at 6 p.m. CST. Today’s data is based on market signals from the previous trading session.
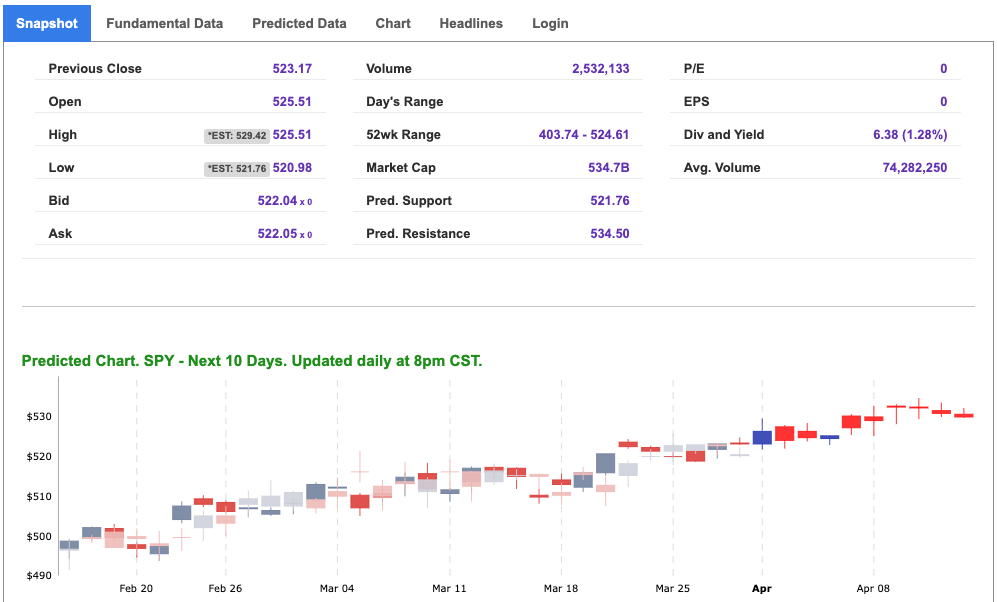
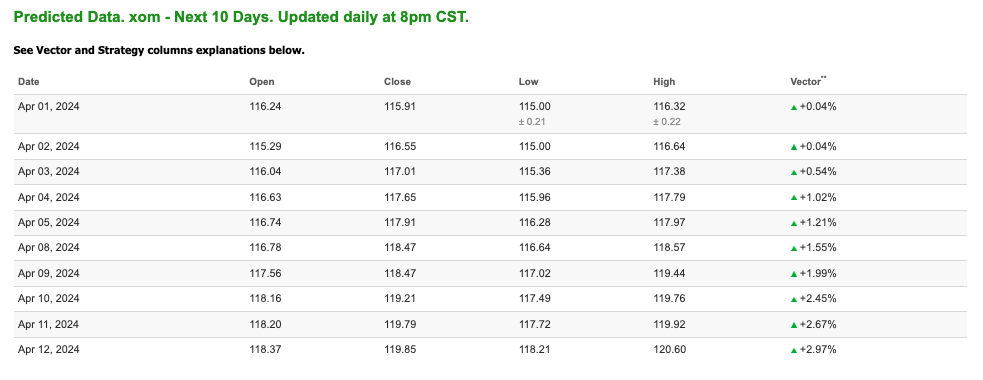
Note: The Vector column calculates the change of the Forecasted Average Price for the next trading session relative to the average of actual prices for the last trading session. The column shows the expected average price movement “Up or Down”, in percent. Trend traders should trade along the predicted direction of the Vector. The higher the value of the Vector the higher its momentum.
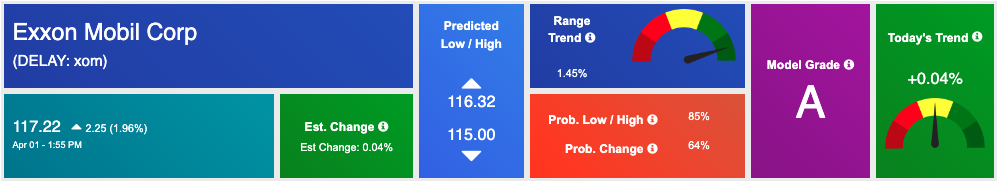
*Please note: At the time of publication Vlad Karpel does have a position in the featured symbol, XOM. Our featured symbol is part of your free subscription service. It is not included in any paid Tradespoon subscription service. Vlad Karpel only trades his money in paid subscription services. If you are a paid subscriber, please review your Premium Member Picks, ActiveTrader, or MonthlyTrader recommendations. If you are interested in receiving Vlad’s picks, please click here.
West Texas Intermediate for Crude Oil delivery (CL.1) is priced at $83.66 per barrel, up 0.83%, at the time of publication.
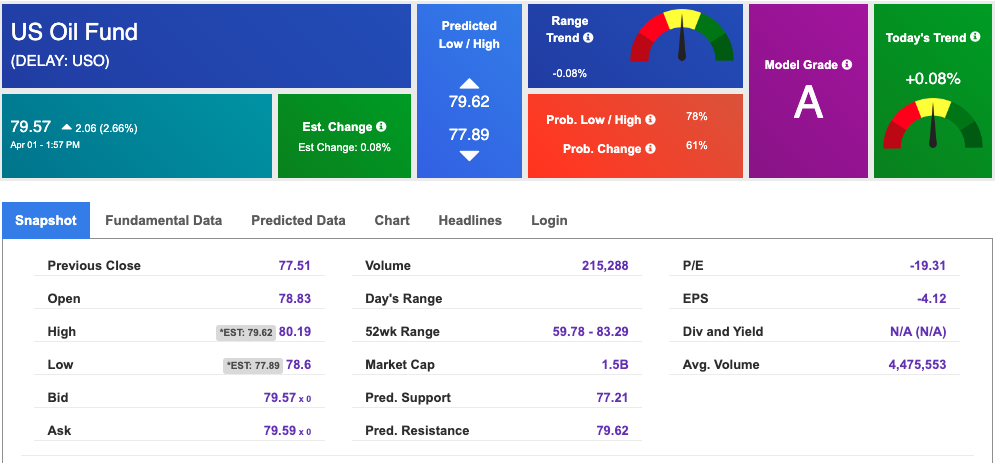
Looking at USO, a crude oil tracker, our 10-day prediction model shows mixed signals. The fund is trading at $79.57 at the time of publication. Prediction data is uploaded after the market close at 6 p.m., CST. Today’s data is based on market signals from the previous trading session.
The price for the Gold Continuous Contract (GC00) is up 1.03% at $2261.50 at the time of publication.
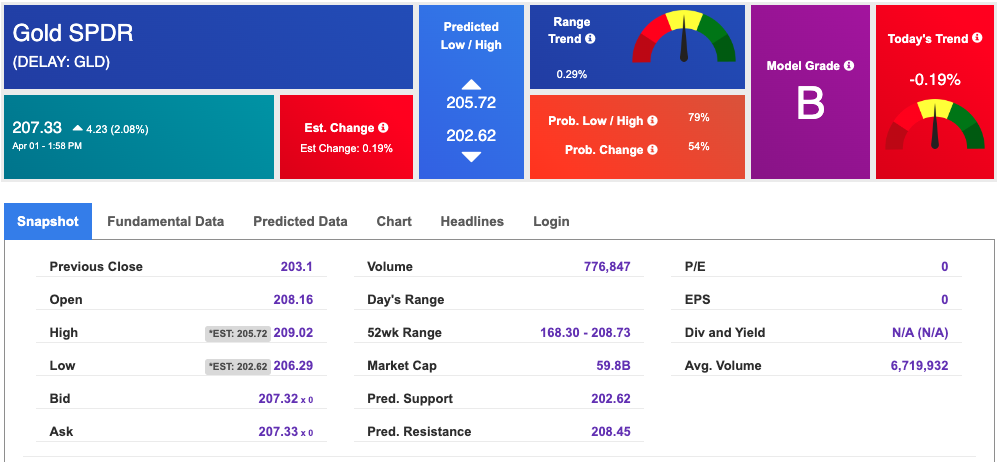
Using SPDR GOLD TRUST (GLD) as a tracker in our Stock Forecast Tool, the 10-day prediction window shows mixed signals. The gold proxy is trading at $207.33 at the time of publication. Vector signals show -0.19% for today. Prediction data is uploaded after the market close at 6 p.m., CST. Today’s data is based on market signals from the previous trading session.
The yield on the 10-year Treasury note is up at 4.330% at the time of publication.
The yield on the 30-year Treasury note is up at 4.468% at the time of publication.
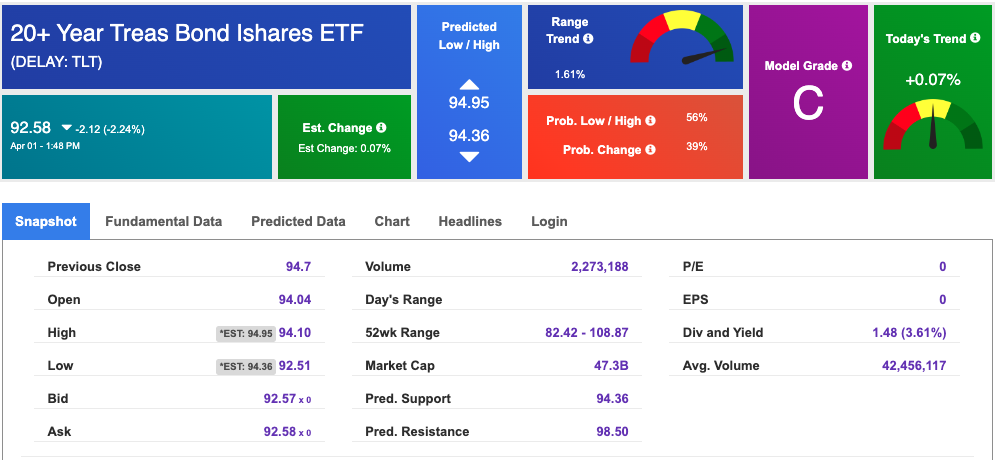
Using the iShares 20+ Year Treasury Bond ETF (TLT) as a proxy for bond prices in our Stock Forecast Tool, we see mixed signals in our 10-day prediction window. Prediction data is uploaded after the market close at 6 p.m., CST. Today’s data is based on market signals from the previous trading session.
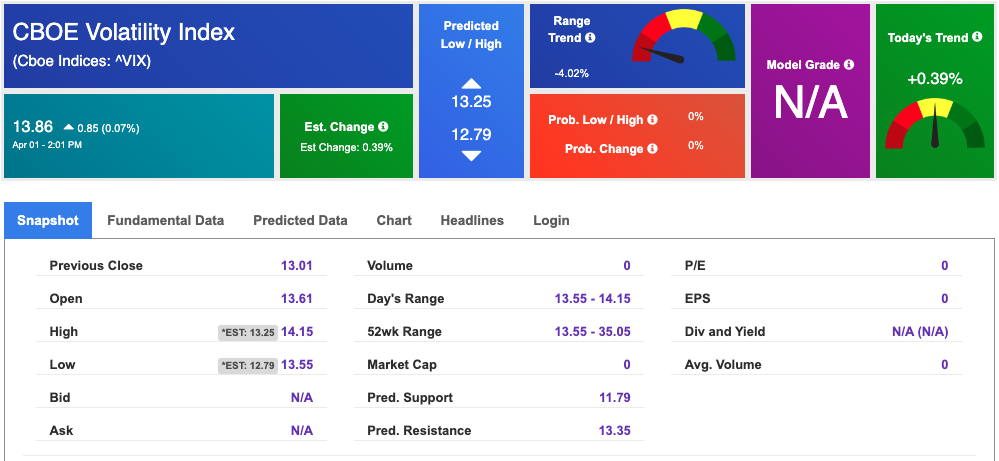
The CBOE Volatility Index (^VIX) is priced at $13.86 up 0.07% at the time of publication, and our 10-day prediction window shows mixed signals. Prediction data is uploaded after the market close at 6 p.m., CST. Today’s data is based on market signals from the previous trading session.
Please share this Tradespoon Market Commentary with your friends.
![]()

![]()
Comments Off on


Tradespoon Tools make finding winning trades in minute as easy as 1-2-3.
Our simple 3 step approach has resulted in an average return of almost 20% per trade!

