 Save Big on Commissions ($0.65 per Contract)
CLICK HERE TO LEARN MORE
Save Big on Commissions ($0.65 per Contract)
CLICK HERE TO LEARN MORE
The start of the trading week saw all three major U.S. indices closing in positive territory on Monday. The market opened with a slight uptick as investors eagerly awaited further updates scheduled throughout the week. With a third of S&P companies lined up to report, this week is anticipated to be the most active period of the second-quarter earnings season. Investors are keeping a keen eye on key economic data, including the latest U.S. jobs figures and purchasing managers’ indexes, for further insights into the state of the economy.
Tuesday will witness earnings releases from notable companies such as Advanced Micro Devices, Caterpillar, Marriott International, Pfizer, Starbucks, and Uber Technologies. The following day, Wednesday, will showcase earnings highlights from CVS Health, PayPal Holdings, Qualcomm, Shopify, and Simon Property Group. On Thursday, the spotlight will be on Airbnb, Alibaba Group Holding, Amazon.com, and Apple, while the week will conclude with earnings reports from Cboe Global Markets, Dominion Energy, and LyondellBasell Industries on Friday.
Among the critical economic data being released this week, the Bureau of Labor Statistics will publish the Job Openings and Labor Turnover Survey on Tuesday. Economists predict a slight decline in job openings compared to the previous month. On Friday, the monthly jobs data will be unveiled, with economists expecting a gain of 200,000 nonfarm payrolls for July, following a rise of 209,000 in June. The unemployment rate is expected to remain at a historically low 3.6%. Furthermore, the Institute for Supply Management will release its manufacturing purchasing managers’ index for July on Tuesday, followed by the services equivalent on Thursday.
Overseas, Asian markets experienced positive momentum on Monday, with Chinese manufacturing activity contracting for a fourth consecutive month in July. However, investors remained optimistic due to the country’s stimulus measures. Meanwhile, the Bank of Japan intervened as bond yields surged. Despite mixed results in European markets, Asian markets closed on a positive note.
As the market continues to trend higher, experts anticipate increased volatility in the second half of the year. Amidst encouraging economic data indicating a low likelihood of a recession and a significant pullback in $DXY, some analysts are adopting a market-neutral stance. While the S&P 500 is projected to rally up to levels between $450 and $470, short support is expected to be in the range of $400-430 over the coming months. For reference, the SPY Seasonal Chart is shown below:
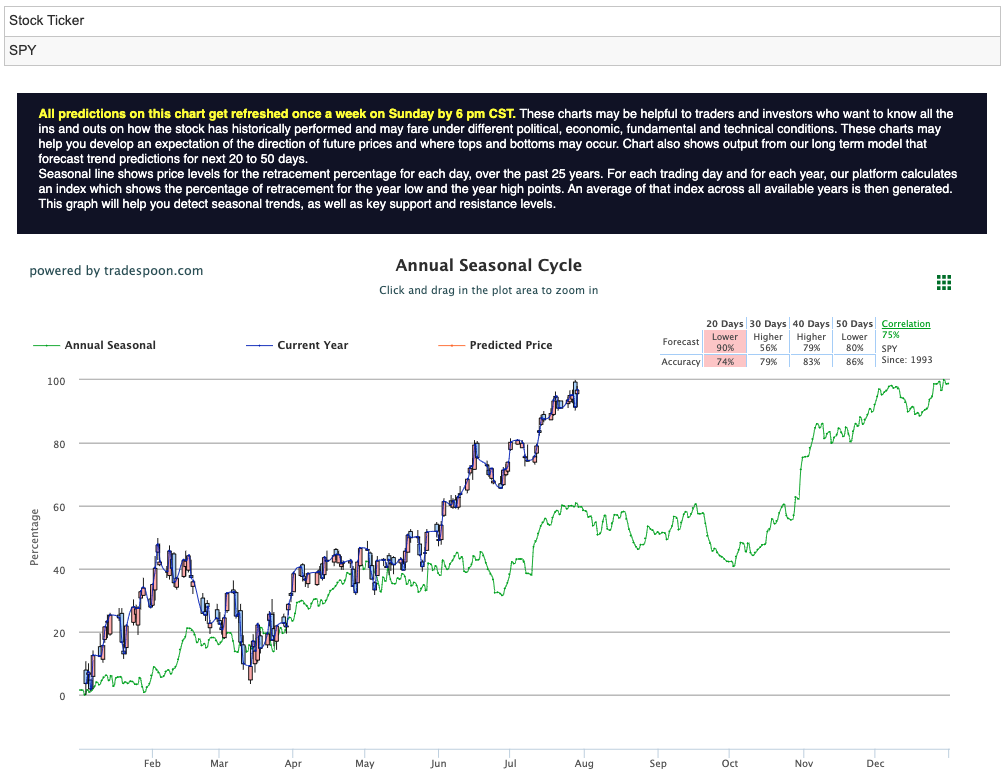
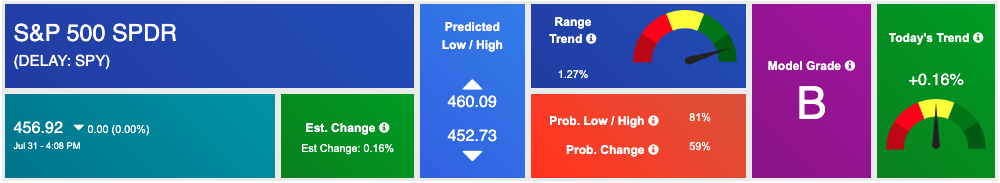
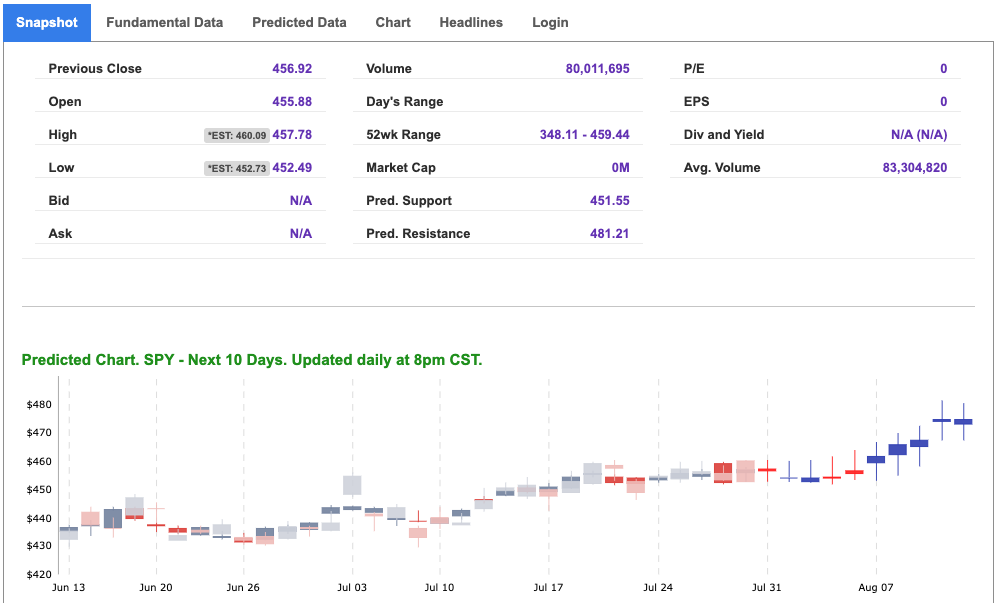
Using the “SPY” symbol to analyze the S&P 500 our 10-day prediction window shows a near-term positive outlook. Prediction data is uploaded after the market closes at 6 p.m. CST. Today’s data is based on market signals from the previous trading session.
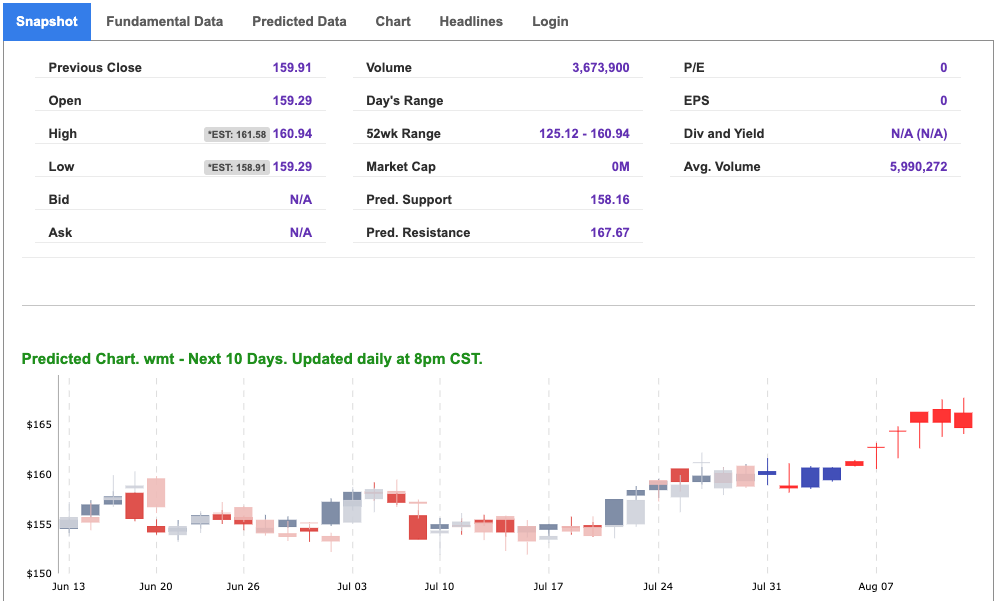
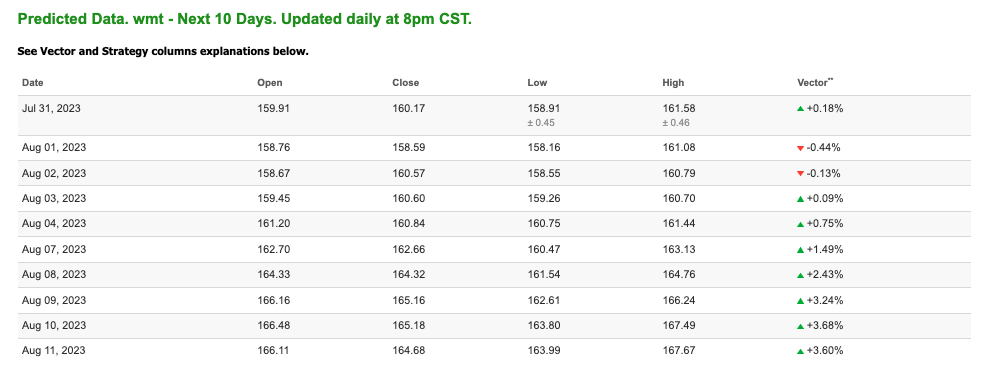
Note: The Vector column calculates the change of the Forecasted Average Price for the next trading session relative to the average of actual prices for the last trading session. The column shows the expected average price movement “Up or Down”, in percent. Trend traders should trade along the predicted direction of the Vector. The higher the value of the Vector the higher its momentum.
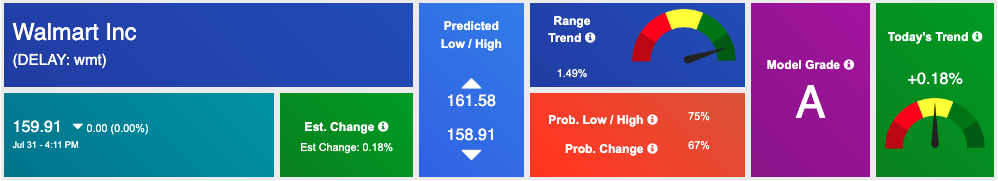
*Please note: At the time of publication Vlad Karpel does NOT have a position in the featured symbol, wmt. Our featured symbol is part of your free subscription service. It is not included in any paid Tradespoon subscription service. Vlad Karpel only trades his money in paid subscription services. If you are a paid subscriber, please review your Premium Member Picks, ActiveTrader, or MonthlyTrader recommendations. If you are interested in receiving Vlad’s picks, please click here.
West Texas Intermediate for Crude Oil delivery (CL.1) is priced at $81.76 per barrel, up 1.46%, at the time of publication.
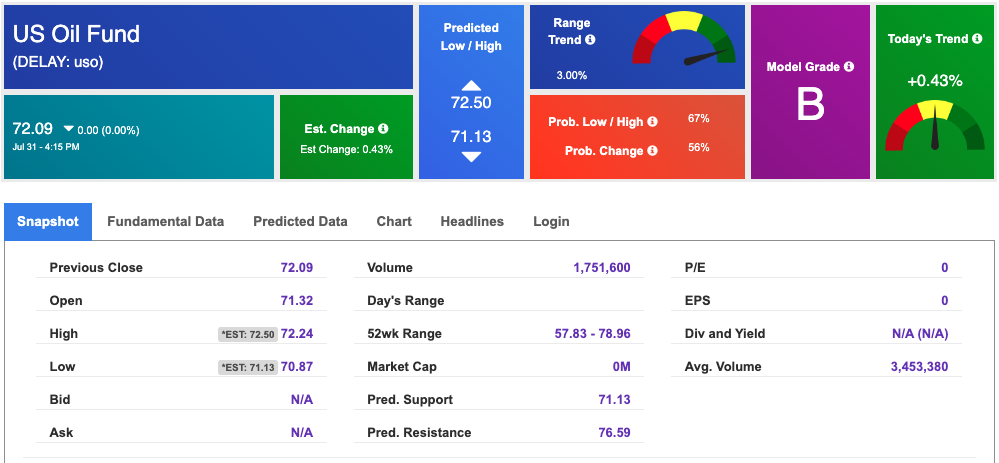
Looking at USO, a crude oil tracker, our 10-day prediction model shows mixed signals. The fund is trading at $72.09 at the time of publication. Prediction data is uploaded after the market close at 6 p.m., CST. Today’s data is based on market signals from the previous trading session.
The price for the Gold Continuous Contract (GC00) is up 0.19% at $2003.60 at the time of publication.
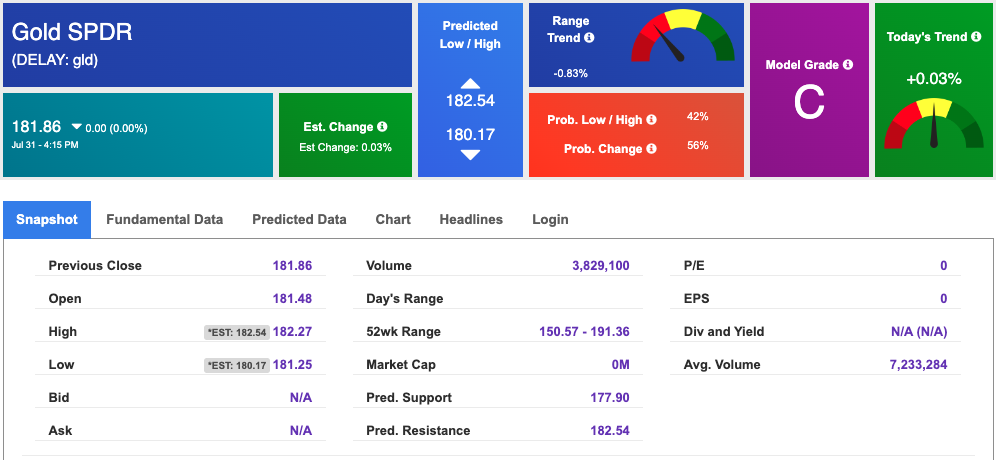
Using SPDR GOLD TRUST (GLD) as a tracker in our Stock Forecast Tool, the 10-day prediction window shows mixed signals. The gold proxy is trading at $181.86 at the time of publication. Vector signals show +0.03% for today. Prediction data is uploaded after the market close at 6 p.m., CST. Today’s data is based on market signals from the previous trading session.
The yield on the 10-year Treasury note is up at 3.959% at the time of publication.
The yield on the 30-year Treasury note is down at 4.011% at the time of publication.
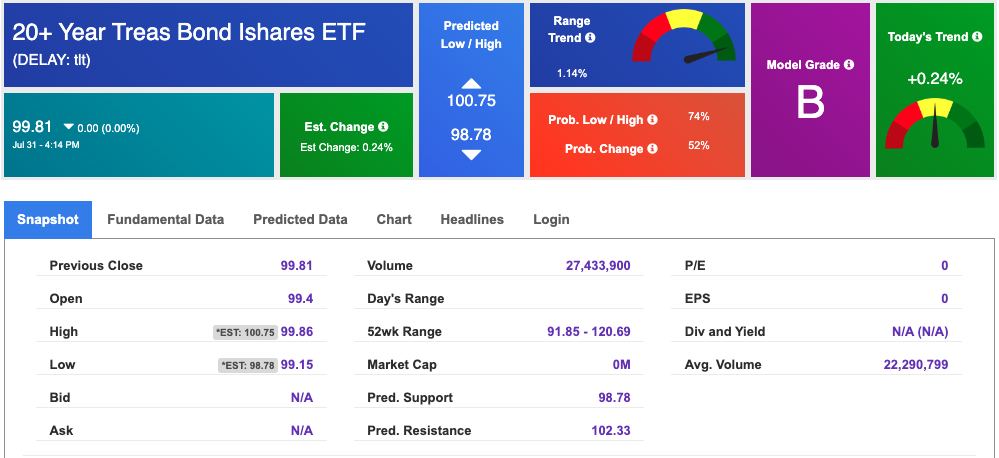
Using the iShares 20+ Year Treasury Bond ETF (TLT) as a proxy for bond prices in our Stock Forecast Tool, we see mixed signals in our 10-day prediction window. Prediction data is uploaded after the market close at 6 p.m., CST. Today’s data is based on market signals from the previous trading session.
The CBOE Volatility Index (^VIX) is priced at $13.63, up 2.25% at the time of publication, and our 10-day prediction window shows mixed signals. Prediction data is uploaded after the market close at 6 p.m., CST. Today’s data is based on market signals from the previous trading session.
Please share this Tradespoon Market Commentary with your friends.
![]()

![]()
Comments Off on


Tradespoon Tools make finding winning trades in minute as easy as 1-2-3.
Our simple 3 step approach has resulted in an average return of almost 20% per trade!