Stocks stumbled on Wednesday, but they recovered some of their losses after a Bloomberg report indicated that Swiss authorities and Credit Suisse were discussing ways to stabilize the bank. Nevertheless, Credit Suisse’s troubles still weighed on the banking sector, pushing down the market. The bank’s share price hit an all-time low after the Saudi National Bank, its top shareholder, said that it would not invest any further in the Swiss bank. The news came one day after Credit Suisse released a report highlighting weaknesses in the firm’s financial controls, causing American depository receipts of Credit Suisse to plummet by approximately 20%. These concerns over the banking sector were already impacting U.S. bank stocks, which had already been struggling to recover from the initial decline caused by the failure of Silicon Valley Bank.
The latest batch of economic reports also weighed on investor sentiment. Producer-price inflation slowed in February more than economists had expected, as wholesale inflation fell decisively to 4.6% year over year, down from 5.7% in January and well below the growth of 5.4% that was expected among economists. The decline in goods inflation was due to a 36.1% drop in prices for key foods, such as chicken eggs. The Producer Price Index (PPI) fell on a monthly basis by 0.1%, below the 0.3% growth estimated by economists. Investors are interpreting this to suggest that the Federal Reserve is likely to be more accommodative with monetary policy when it makes its next interest-rate decision this month.
Retail sales also tumbled in February, falling by 0.4% compared to expectations of a 0.1% decline. The pullbacks in spending were seen across various categories, including a 4% decline in department store sales, a 2.5% fall in furniture store sales, a 2.2% decrease in food services, and a 1.8% decline in motor vehicle and parts dealers. The few categories that saw an uptick in spending included food and beverage stores, up 0.5%, and health and personal care stores, up 0.9%. The report suggests that shoppers may be feeling the pinch from higher prices and a softening macroeconomic environment. Inflation is still running hot, with the Consumer Price Index accelerating 6% year-over-year in February, according to new data released by the Bureau of Labor Statistics on Tuesday.
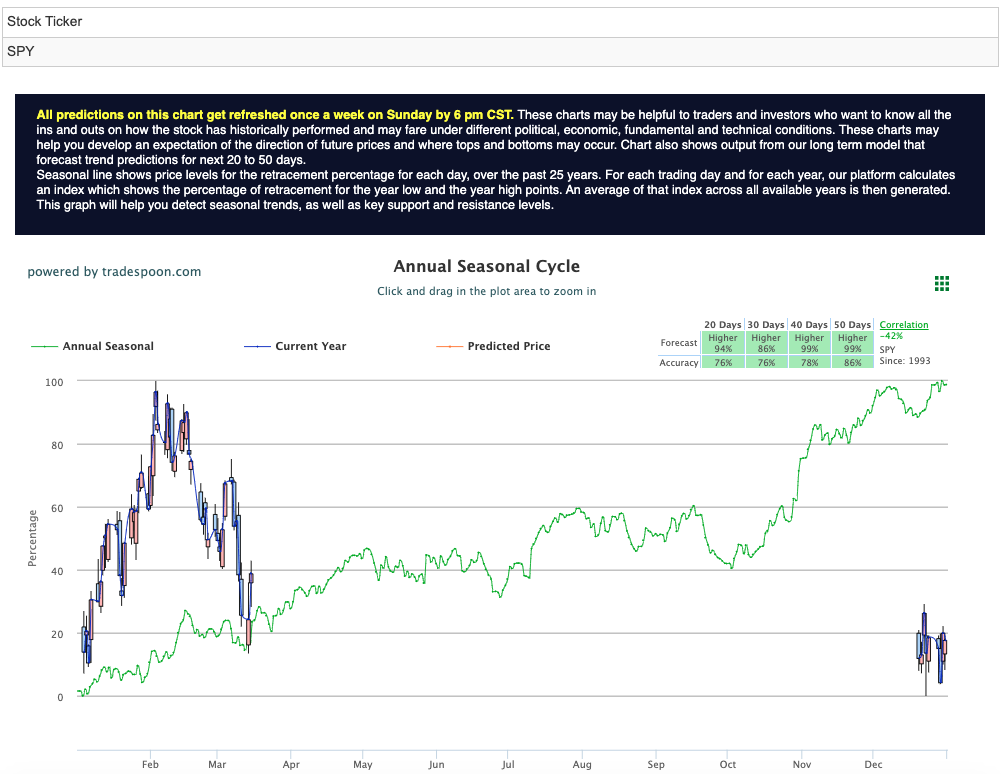
These developments have major implications for the Federal Reserve, which has lifted interest rates eight times in an effort to slow down the economy and battle historically high inflation. Concerns surrounding the banking sector and a fall in retail sales indicate a potential slowdown in the economy and the potential for a recession, which would likely prompt the Federal Reserve to pause its increasing interest rates. Last week, futures markets were pricing in a 75% probability of a 50-basis-point, or half-percentage point, rate increase following February’s 25-basis-point raise; however, this is now expected to alter. Market commentary readers should maintain clearly defined stop levels for all positions. For reference, the SPY Seasonal Chart is shown below:

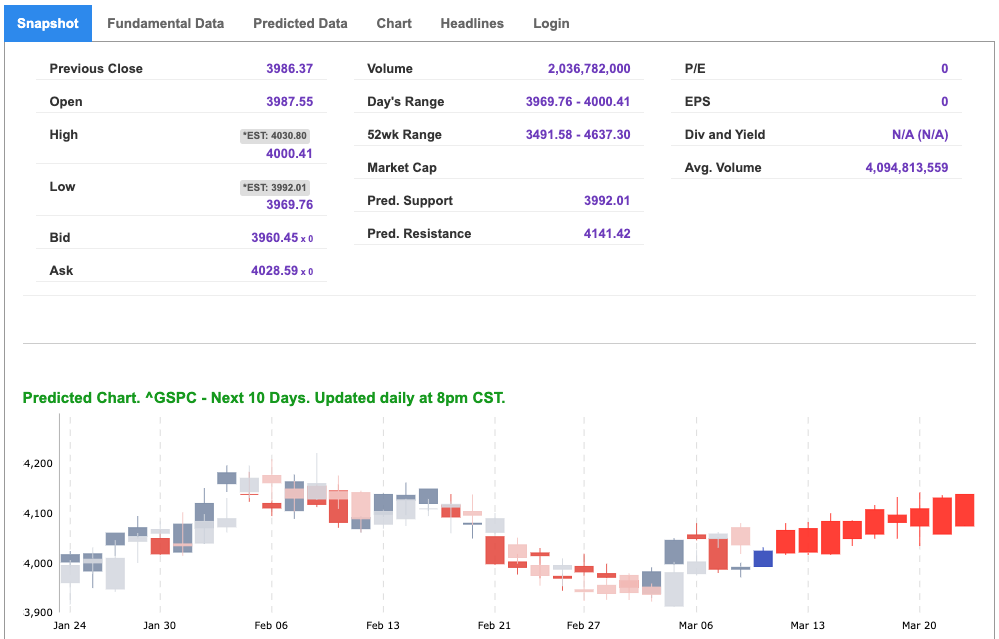

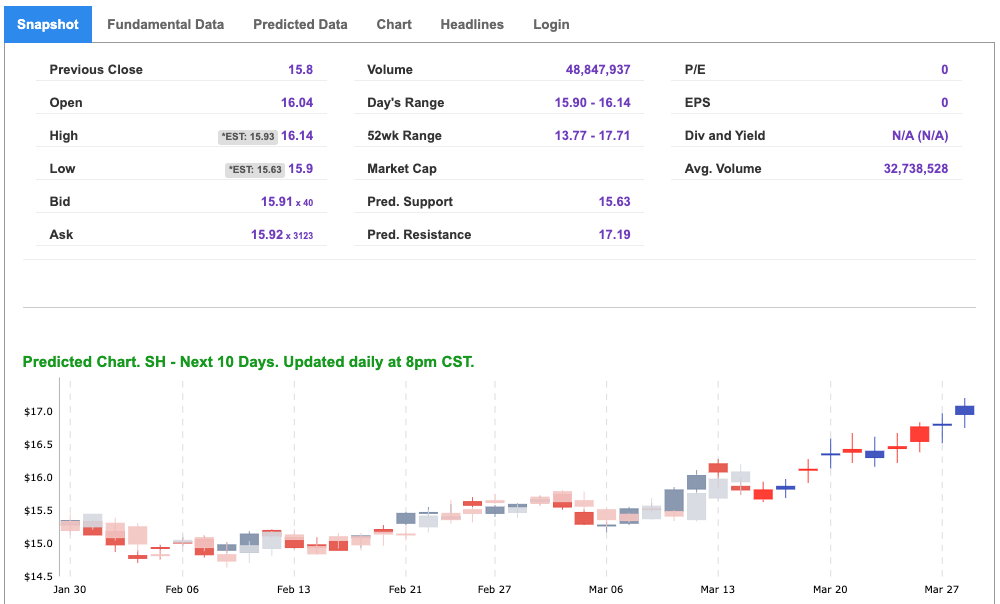
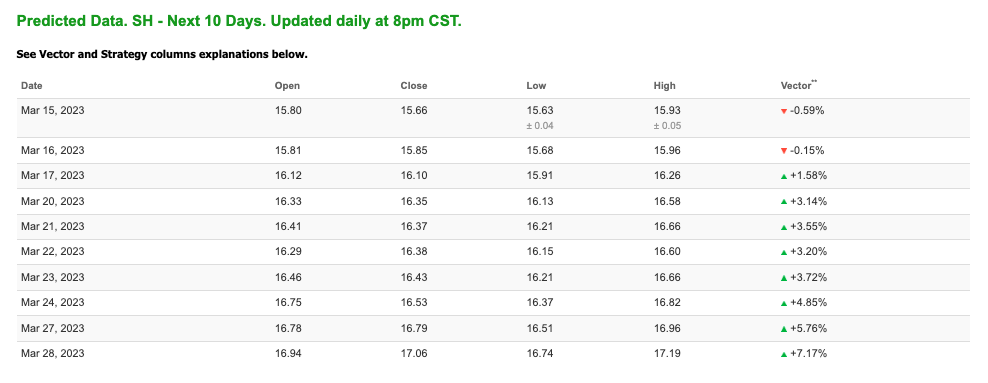
Note: The Vector column calculates the change of the Forecasted Average Price for the next trading session relative to the average of actual prices for the last trading session. The column shows the expected average price movement “Up or Down”, in percent. Trend traders should trade along the predicted direction of the Vector. The higher the value of the Vector the higher its momentum.
*Please note: At the time of publication Vlad Karpel does have a position in the featured symbol, sh. Our featured symbol is part of your free subscription service. It is not included in any paid Tradespoon subscription service. Vlad Karpel only trades his money in paid subscription services. If you are a paid subscriber, please review your Premium Member Picks, ActiveTrader, or MonthlyTrader recommendations. If you are interested in receiving Vlad’s picks, please click here.
West Texas Intermediate for Crude Oil delivery (CL.1) is priced at $68.24 per barrel, down 4.33%, at the time of publication.
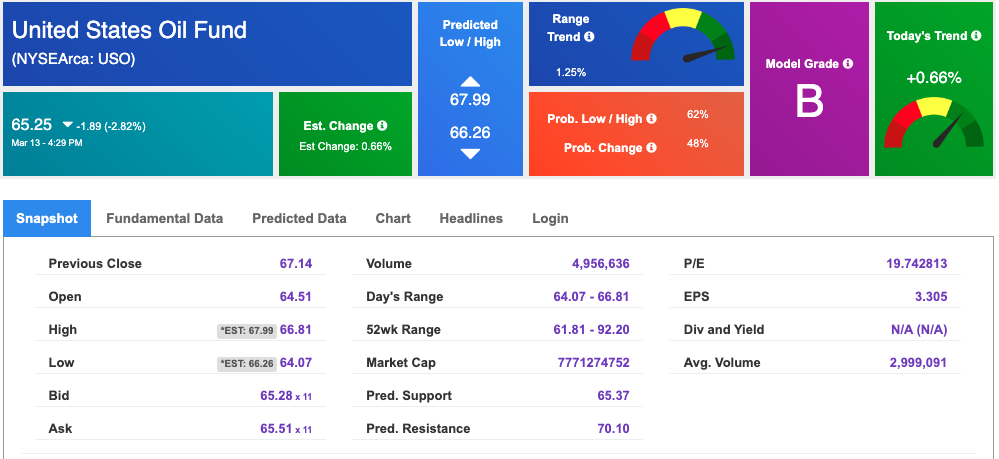
Looking at USO, a crude oil tracker, our 10-day prediction model shows mixed signals. The fund is trading at $65.25 at the time of publication. Prediction data is uploaded after the market close at 6 p.m., CST. Today’s data is based on market signals from the previous trading session.
The price for the Gold Continuous Contract (GC00) is up 0.65% at $1923.30 at the time of publication.
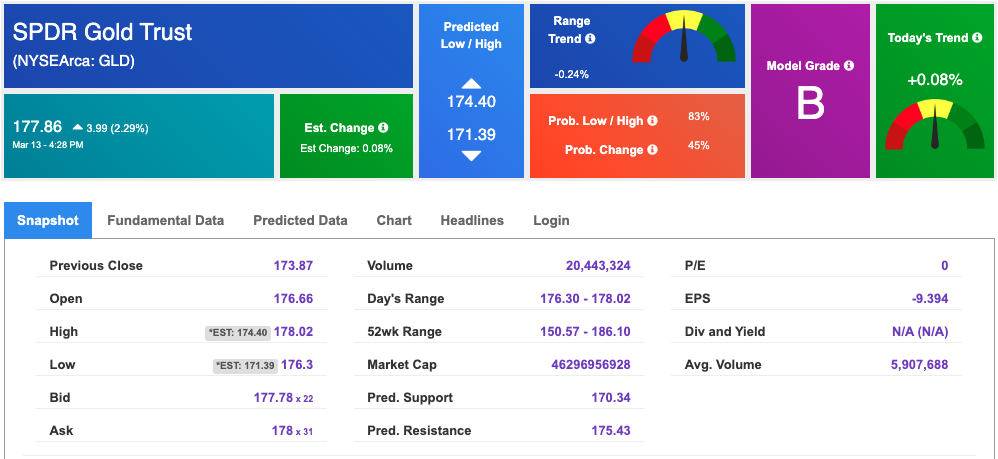
Using SPDR GOLD TRUST (GLD) as a tracker in our Stock Forecast Tool, the 10-day prediction window shows mixed signals. The gold proxy is trading at $177.86 at the time of publication. Vector signals show +0.08% for today. Prediction data is uploaded after the market close at 6 p.m., CST. Today’s data is based on market signals from the previous trading session.
The yield on the 10-year Treasury note is down at 3.466% at the time of publication.
The yield on the 30-year Treasury note is down at 3.647% at the time of publication.
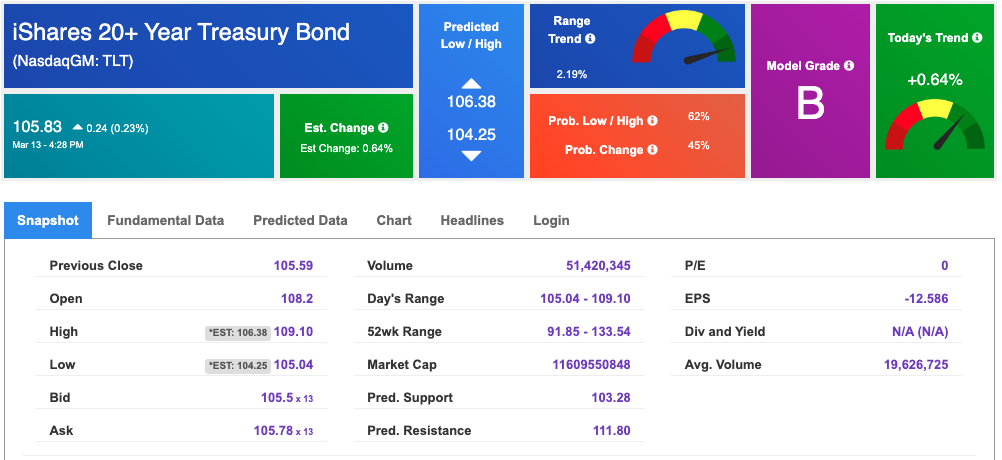
Using the iShares 20+ Year Treasury Bond ETF (TLT) as a proxy for bond prices in our Stock Forecast Tool, we see mixed signals in our 10-day prediction window. Prediction data is uploaded after the market close at 6 p.m., CST. Today’s data is based on market signals from the previous trading session.
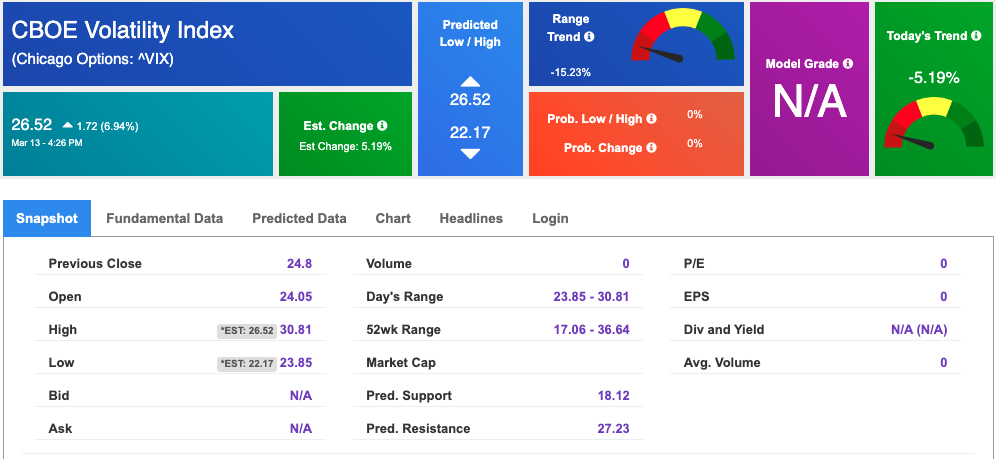
The CBOE Volatility Index (^VIX) is $26.52 at the time of publication, and our 10-day prediction window shows mixed signals. Prediction data is uploaded after the market close at 6 p.m., CST. Today’s data is based on market signals from the previous trading session.
Comments Off on
Tradespoon Tools make finding winning trades in minute as easy as 1-2-3.
Our simple 3 step approach has resulted in an average return of almost 20% per trade!