 Special Offer: Try the 'Tradespoon LIVE Membership' for ONLY $37!
CLICK HERE TO LEARN MORE
Special Offer: Try the 'Tradespoon LIVE Membership' for ONLY $37!
CLICK HERE TO LEARN MORE
Call it a summer stalemate. SPY keeps ricocheting between 630–640 and 580–590, with thinning breadth and a handful of mega-caps steering the tape—so every headline on rates, tariffs, and tech policy lands harder than it should. The inflection arrived on August 1, when July payrolls rose just 73,000 after sizable downward revisions, tipping markets toward a September rate cut and shifting the spotlight to this week’s CPI and Powell’s Jackson Hole guidance later this month.
SPY is still trading within a well-defined band, with sellers appearing near 630–640 and buyers defending 580–590. Under the surface, breadth remains thin and leadership concentrated in a small group of mega-caps, which keeps the tape hypersensitive to every headline on rates, tariffs, and tech policy. The pivot began on August 1 when July payrolls rose just 73,000 with sizable downward revisions—enough to push markets toward a high probability of a September rate cut and to shift focus to this week’s inflation data and Chair Powell’s Jackson Hole remarks later this month.
Trade policy is the other big swing factor. Washington’s new tariff framework took effect on August 7 and materially lifts the average effective U.S. tariff burden, reviving goods-price risk even as energy has eased. Markets whipsawed around those cross-currents: after a sharp selloff to start the month, stocks recovered into last Friday, August 8, with the Nasdaq clocking its 18th record close of the year and now up roughly 95% over five years on the back of the AI build-out. That strength comes with stretched valuations, and a growing chorus of institutional investors describes U.S. equities as overvalued—context for why rallies continue to meet supply at the highs.
AI policy added a fresh wrinkle over the weekend. Reports indicated Nvidia and AMD agreed to remit about 15% of revenue from AI-chip sales in China to the U.S. government under export-license arrangements—an incremental margin headwind even if demand for compute remains strong. Early today, Monday, August 11, the Dow edged higher while the S&P 500 and Nasdaq were little changed, and the 10-year Treasury yield hovered around 4.27%–4.29% as traders positioned for Tuesday’s CPI.
Policy risk isn’t limited to semis. A U.S.–China tariff truce is due to expire on Tuesday; officials have hinted an extension is likely, but the countdown itself keeps headline risk elevated. In energy, crude drifted lower ahead of a planned meeting later this week between President Trump and President Putin in Alaska, with tariffs also stoking concern about the global demand outlook.
From here, the calendar does the talking. CPI lands Tuesday, August 12, PPI follows Thursday, and Friday brings retail sales alongside the University of Michigan sentiment update. Each print feeds directly into the September rate decision and into how aggressively companies guide on costs and demand as earnings season winds down. A couple of late-cycle reports still matter for the AI trade as well, with CoreWeave on deck Tuesday and Cisco mid-week. Until one side of the macro equation breaks decisively—softening growth arguing for cuts versus tariff-driven stickier goods inflation—expect the SPY range to keep doing its job and for both rallies and dips to be driven by the next data point.
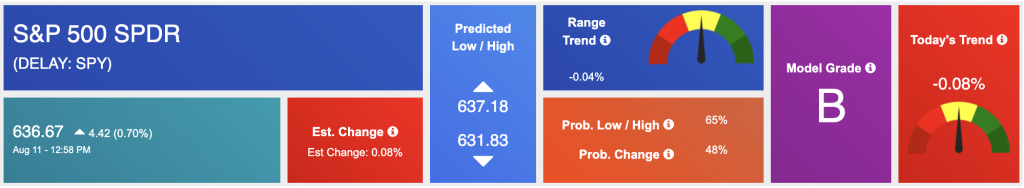
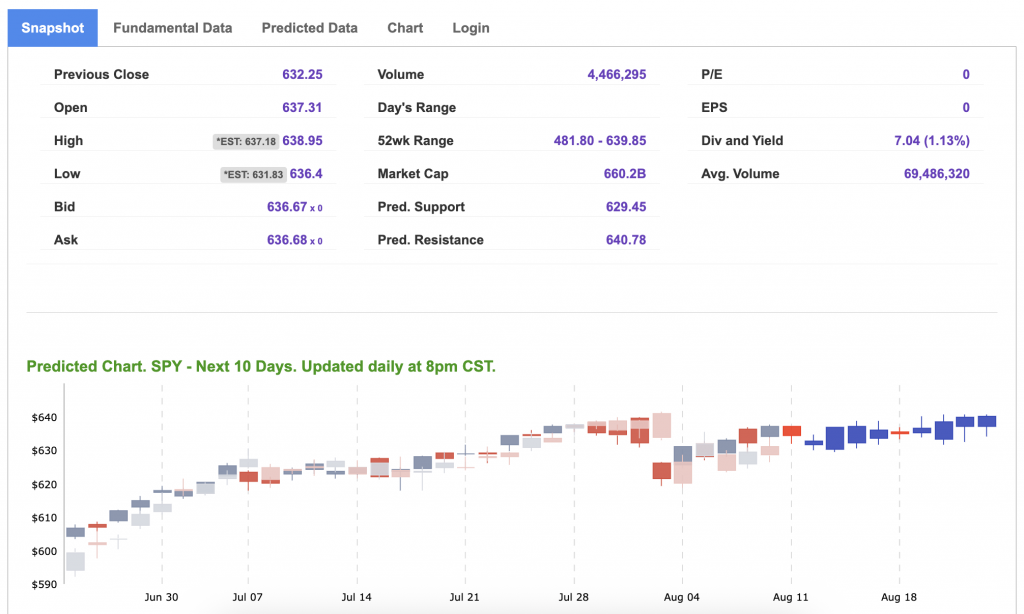
Using the “SPY” symbol to analyze the S&P 500, our 10-day prediction window shows a near-term positive outlook. Prediction data is uploaded after the market closes at 6 p.m. CST. Today’s data is based on market signals from the previous trading session.
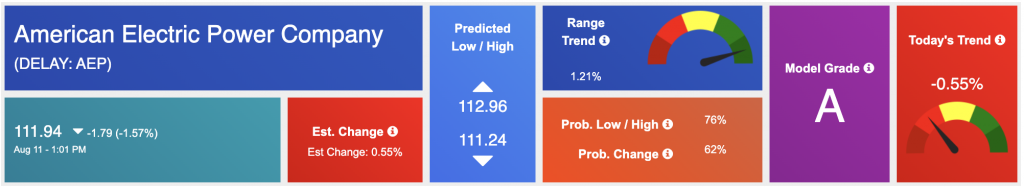
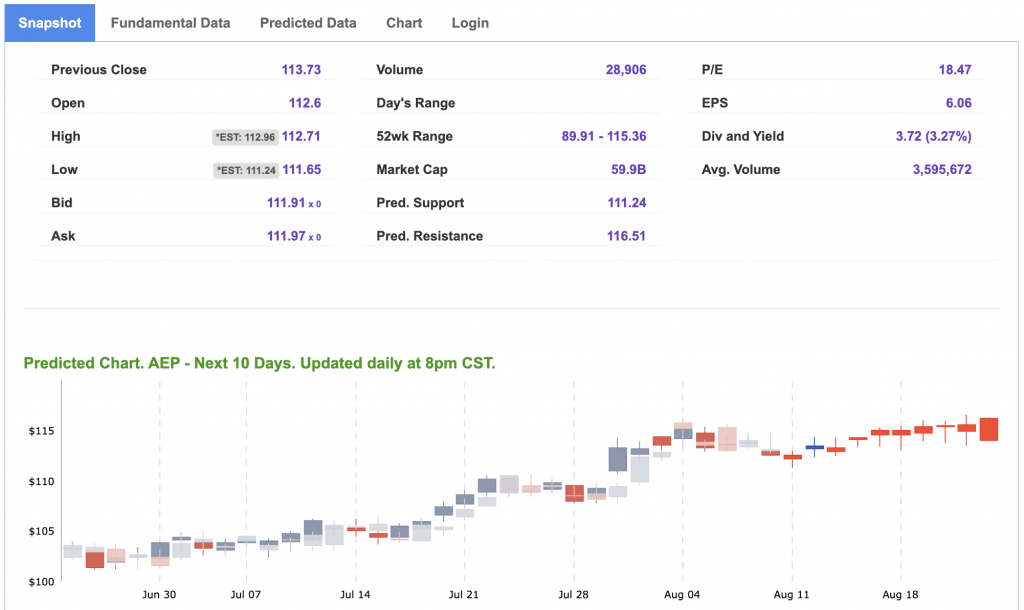
Our featured symbol for Tuesday is AEP. American Electric Power Company – AEP is showing a steady vector in our Stock Forecast Toolbox’s 10-day forecast.
The symbol is trading at $111.94 with a vector of -0.55% at the time of publication.
10-Day Prediction data is uploaded after the market close at 6 p.m., CST. Today’s data is based on market signals from the previous trading session.
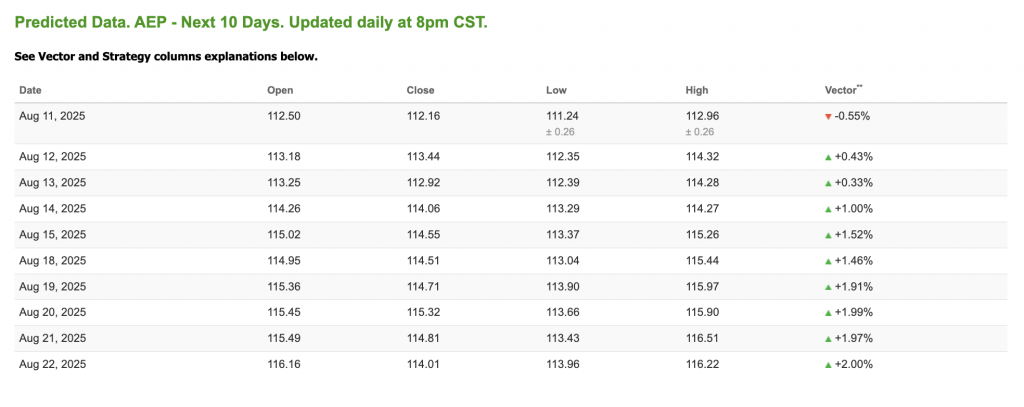
Note: The Vector column calculates the change of the Forecasted Average Price for the next trading session relative to the average of actual prices for the last trading session. The column shows the expected average price movement “Up or Down”, in percent. Trend traders should trade along the predicted direction of the Vector. The higher the value of the Vector the higher its momentum.
*Please note: At the time of publication, Vlad Karpel does have a position in the featured symbol, AEP. Our featured symbol is part of your free subscription service. It is not included in any paid Tradespoon subscription service. Vlad Karpel only trades his money in paid subscription services. If you are a paid subscriber, please review your Premium Member Picks, ActiveTrader, or MonthlyTrader recommendations. If you are interested in receiving Vlad’s picks, please click here.
West Texas Intermediate for Crude Oil delivery (CL.1) is priced at $66.60 per barrel, UP 2.23%, at the time of publication.
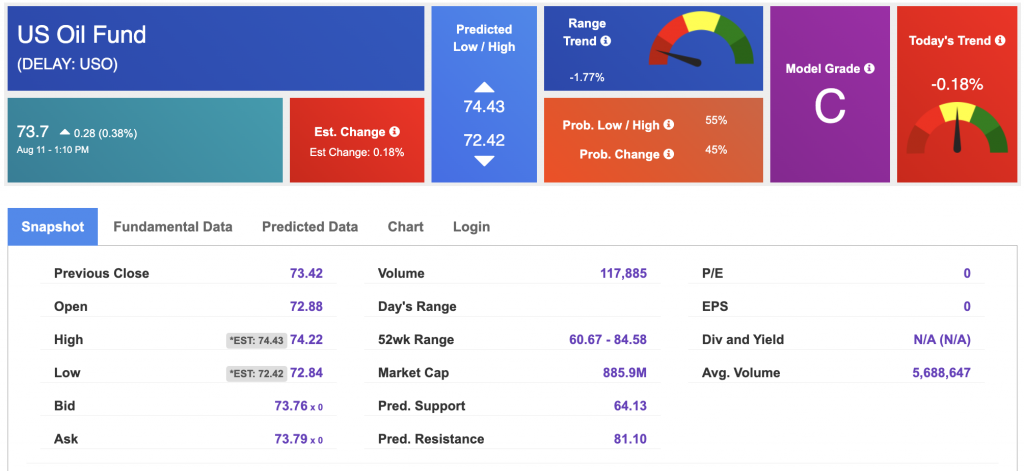
Looking at USO, a crude oil tracker, our 10-day prediction model shows mixed signals. The fund is trading at $73.7 at the time of publication. Prediction data is uploaded after the market close at 6 p.m., CST. Today’s data is based on market signals from the previous trading session.
The price for the Gold Continuous Contract (GC00) is DOWN 0.73% at $3,331.20 at the time of publication.
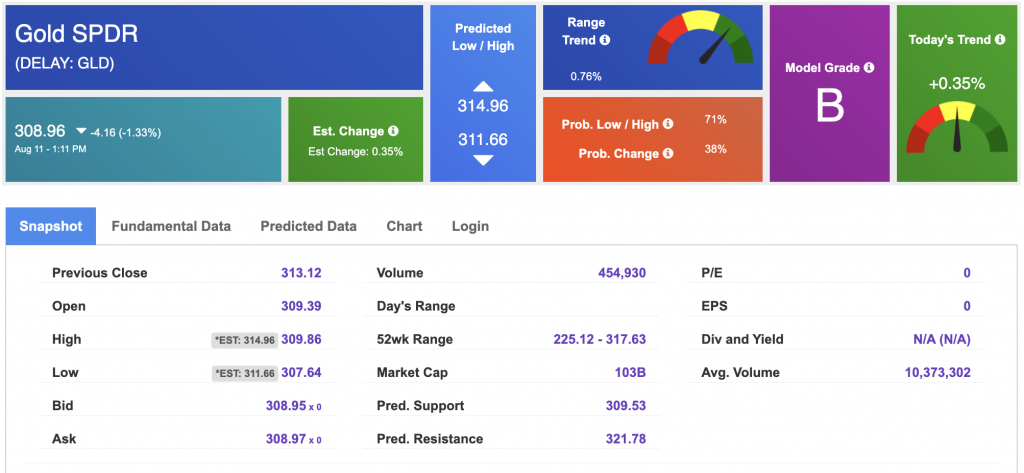
Using SPDR GOLD TRUST (GLD) as a tracker in our Stock Forecast Tool, the 10-day prediction window shows mixed signals. The gold proxy is trading at $308.96 at the time of publication. Vector signals show +0.35% for today. Prediction data is uploaded after the market close at 6 p.m., CST. Today’s data is based on market signals from the previous trading session.
The yield on the 10-year Treasury note is down at 4.208% at the time of publication.
The yield on the 30-year Treasury note is down at 4.798% at the time of publication.
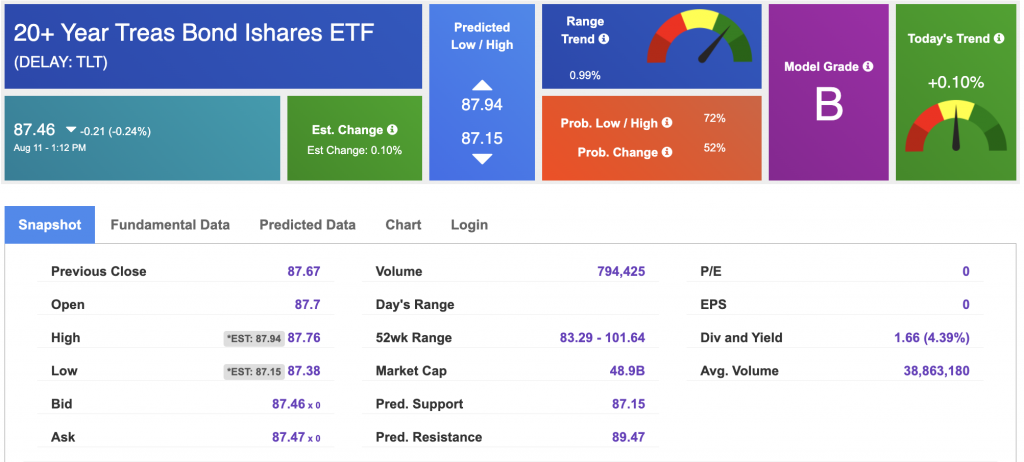
Using the iShares 20+ Year Treasury Bond ETF (TLT) as a proxy for bond prices in our Stock Forecast Tool, we see mixed signals in our 10-day prediction window. Prediction data is uploaded after the market close at 6 p.m., CST. Today’s data is based on market signals from the previous trading session.
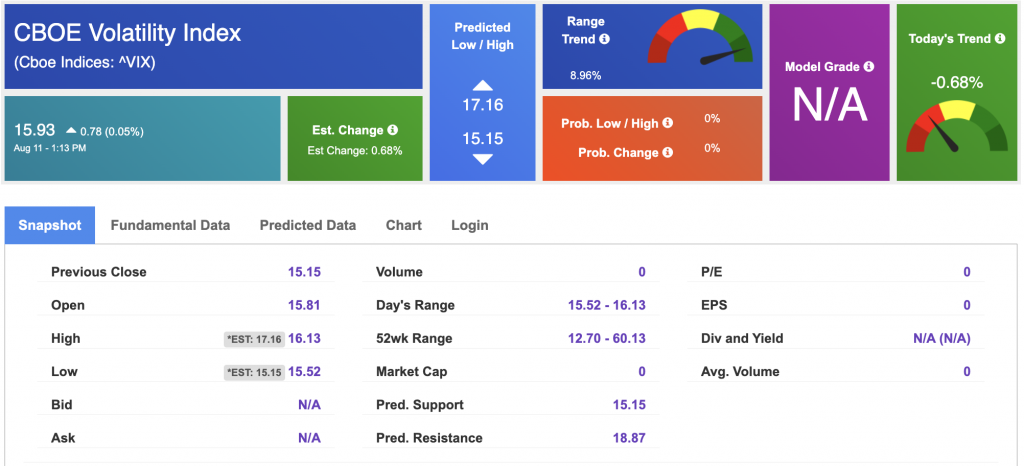
The CBOE Volatility Index (^VIX) is priced at $15.93 at the time of publication, and our 10-day prediction window shows mixed signals. Prediction data is uploaded after the market close at 6 p.m., CST. Today’s data is based on market signals from the previous trading session.
Please share this Tradespoon Market Commentary with your friends.
![]()

![]()
Comments Off on


Tradespoon Tools make finding winning trades in minute as easy as 1-2-3.
Our simple 3 step approach has resulted in an average return of almost 20% per trade!

