 Special Offer: Try the 'Vlad's Portfolio Membership' for ONLY $37!
CLICK HERE TO LEARN MORE
Special Offer: Try the 'Vlad's Portfolio Membership' for ONLY $37!
CLICK HERE TO LEARN MORE
The past stretch has felt less like a clean continuation and more like a controlled cooldown—exactly what you’d expect after a year as strong as 2025. After gains of roughly +17% for the S&P 500, +14% for the Dow, and more than +40% for the Nasdaq, the bar for “good news” is high, and it doesn’t take much to trigger profit-taking, rotation, or a pause in momentum. With earnings not yet providing fresh catalysts, the market has been shaped more by positioning, liquidity, and leadership than by new corporate surprises, which is why the tape has felt choppier than the index level suggests.
That dynamic has been reinforced by the market’s odd mix of calm and instability. Volatility measures have stayed deceptively low with the VIX hovering in the mid-teens, yet sector swings have been sharp and leadership has looked increasingly concentrated. Thin holiday-to-early-January liquidity has amplified every rotation, making it easier for crowded trades to unwind quickly and for intraday moves to feel more dramatic than the headline closing numbers imply.
The clearest expression of the “positioning snapback” came in precious metals. After silver surged into record territory above $80 and gold printed new highs, both reversed hard—silver falling as much as 7% and gold dropping more than 3% at one point. Those kinds of moves rarely reflect a sudden change in long-term conviction. They more often reflect the mechanics of crowded positioning meeting thin liquidity: the theme can remain intact, but the path becomes uneven when too many players try to exit at once.
Equities carried the same message, just in a more nuanced form. Early weakness showed up in big tech, with heavyweight names like Nvidia and Tesla slipping more than 1% and leaning on the broader complex. There was also a dose of classic year-end housekeeping, with analysts trimming price targets in parts of consumer staples as portfolios were cleaned up and risk was repositioned for a new calendar year. The important point, though, is that this did not feel like a wholesale rejection of risk. It felt like investors selectively de-risking and rotating while keeping core exposure intact.
Macro data added to that balancing act. Growth still looks firm on a backward-looking basis, with Q3 GDP reported at 4.3%, but consumer confidence slid to 89.1, reflecting more anxiety around jobs and income stability. That split—strong historical growth but softer forward-looking confidence—helps explain why markets can hover near highs while still feeling fragile intraday. Rates layered in another source of tension, with the 10-year yield swinging in a wide band between roughly 3.6% and 4.2%. Even when equities don’t look stressed, that kind of yield volatility keeps the “higher for longer” risk alive and can quietly compress valuations at the margin.
Friday’s action summed it up perfectly. The major indexes entered 2026 coming off a four-day losing streak, began the session with gains, and then faded into sideways trading. Software weakness weighed on the S&P 500 and Nasdaq, but the market leaned on its most reliable pillar: the AI trade. Semiconductors stepped in as the stabilizer even when the rest of tech looked uneven, and the internal picture was stronger than the headline index action. Breadth was solid, with hundreds of S&P 500 stocks tracking higher even as the index struggled to extend the bounce—an important signal that this has been more digestion and rotation than outright risk-off behavior.
Single-stock headlines fit the same theme of selective enthusiasm. Tesla’s fourth-quarter deliveries landed slightly below consensus at 418,227 versus expectations around 422,850, which wasn’t a catastrophe but wasn’t inspiring either. Rivian’s production and deliveries came in broadly in line with its own expectations. Chinese EV makers showed mixed but generally strong December unit trends, keeping that pocket active without turning it into a defining market driver.
In commodities, oil stayed subdued near three-month averages after a steep 2025 decline, with Brent around $60 and WTI near $57. The backdrop remains conflicted: supply gluts and a weak prior year keep a lid on prices, while geopolitical tensions can still inject a risk premium quickly if the market starts to view disruption risk as durable rather than episodic.
Then this week opened with a genuine shock catalyst and an equally revealing market response. The U.S. military operation that led to the capture of Venezuelan President Nicolás Maduro immediately raised the geopolitical temperature, and precious metals reacted the way you’d expect as investors reached for safe-haven protection. Yet equities didn’t flinch—in fact, the Dow surged to record territory above 49,000, with energy and financials doing much of the heavy lifting. That rally was broad enough to include the typical “risk-on” expressions, while bonds also held up as the 10-year yield eased to roughly 4.16%. It was a textbook example of how this market behaves when it’s healthy but cautious: investors will buy the dip and rotate into perceived beneficiaries, while still keeping one hand on the safety rail.
At the same time, the economic picture stayed mixed. The ISM manufacturing PMI came in at 47.9 for December, down from 48.2 and below expectations, marking another month of contraction and highlighting that parts of the real economy remain under pressure even as equity indexes sit near highs. That tension—equity resilience versus pockets of economic softness—is becoming one of the defining features of this early-2026 setup.
Global markets have echoed the same selective risk appetite. India has continued to notch records, while Asia has traded mixed as investors recalibrate U.S. rate-cut expectations and track shifts in U.S.–China tensions, including Nvidia resuming chip shipments to China. Meanwhile, the market’s attention remains anchored to the next chapter of the AI buildout as investors look ahead to 2026 hardware roadmaps, Nvidia’s Vera Rubin cycle, AMD’s rack-scale push, and the accelerating demand for custom silicon across the ecosystem.
The best way to describe sentiment right now is constructive, but more disciplined. The mood is still positive—there is no sign of a broad panic—and the willingness to buy dips remains present, especially when the trade ties into leadership themes like semiconductors and AI infrastructure. But the tape is also less forgiving than it was during smoother uptrends. Crowded positioning is getting punished faster, thin liquidity is making rotations feel louder, and investors are demanding better entry points rather than chasing strength reflexively. Even with volatility readings staying calm, volatility in experience has been real because the market’s leadership is concentrated and the flows are more reactive.
Taken together, this still looks like a normal consolidation after a huge year rather than the start of a new bear phase. The longer-term trend appears intact, but the near-term environment is more two-sided because the same few levers keep determining outcomes: rates, leadership concentration, and forward-looking confidence signals. That’s why I’m staying market-neutral here. Momentum has deteriorated even as prices remain elevated, and the main risk remains a higher-for-longer rate backdrop—especially if unemployment starts to tick up and consumer confidence continues to soften. At the same time, as long as leadership holds and breadth doesn’t meaningfully break down, the market has room to grind.
From a tactical standpoint, I still see the SPY capable of reaching the 700–720 area if semiconductors and the broader AI complex remain the stabilizing force and yields cooperate. But 650–660 is the key support zone I want respected over the next few months as this consolidation plays out, because that area effectively becomes the test of whether we’re seeing healthy digestion or something more structural. If that support holds on pullbacks, I’m comfortable treating weakness as rotation-driven rather than as a warning siren. If it fails, the “calm” at the surface can change quickly, and the market may be forced to reprice risk more aggressively than investors expect.
The immediate focus, then, is on whether rates settle down or re-accelerate, whether consumer confidence stabilizes or continues to slide, and whether manufacturing weakness stays contained or starts to bleed more meaningfully into employment. Layer on the geopolitical backdrop—where a one-day shock can become a multi-week theme if energy or inflation expectations shift—and it becomes clear why patience and selectivity are the right posture. This is still a market that can trend higher, but it’s no longer one that rewards careless chasing.
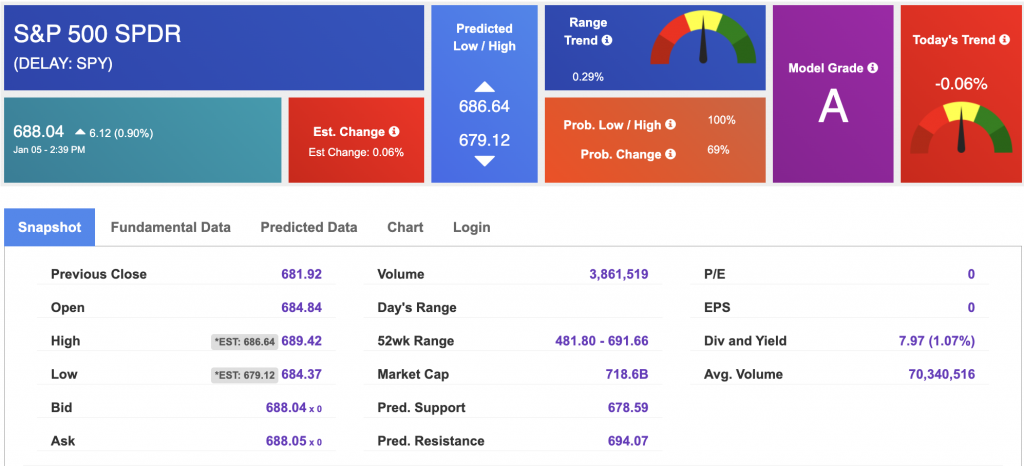
Using the “SPY” symbol to analyze the S&P 500, our 10-day prediction window shows a near-term positive outlook. Prediction data is uploaded after the market closes at 6 p.m. CST. Today’s data is based on market signals from the previous trading session.
West Texas Intermediate for Crude Oil delivery (CL.1) is priced at $58.34 per barrel, up 1.78%, at the time of publication.
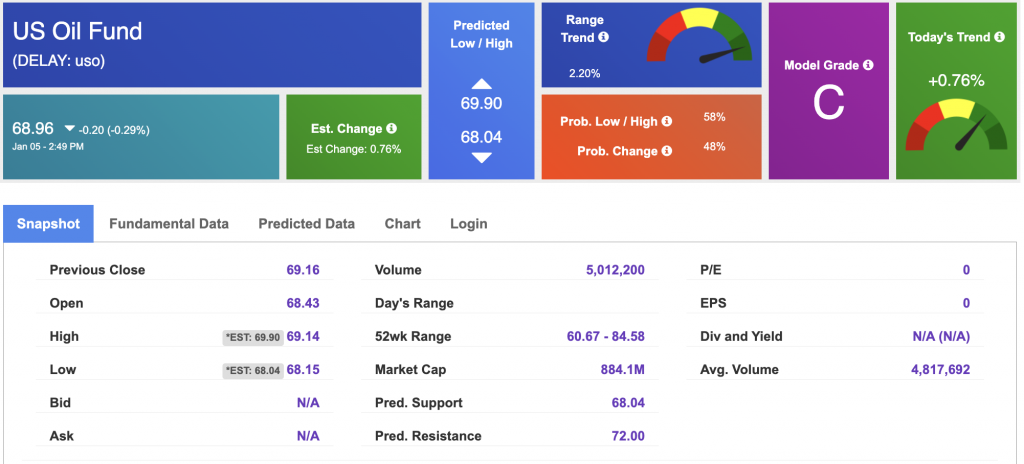
Looking at USO, a crude oil tracker, our 10-day prediction model shows mixed signals. The fund is trading at $68.96 at the time of publication. Prediction data is uploaded after the market close at 6 p.m., CST. Today’s data is based on market signals from the previous trading session.
The price for the Gold Continuous Contract (GC00) is up 2.80% at $4,451.50 at the time of publication.

Using SPDR GOLD TRUST (GLD) as a tracker in our Stock Forecast Tool, the 10-day prediction window shows mixed signals. The gold proxy is trading at $398.28 at the time of publication. Vector signals show +0.76% for today. Prediction data is uploaded after the market close at 6 p.m., CST. Today’s data is based on market signals from the previous trading session.
The yield on the 10-year Treasury note is down at 4.159% at the time of publication.
The yield on the 30-year Treasury note is down at 4.843% at the time of publication.
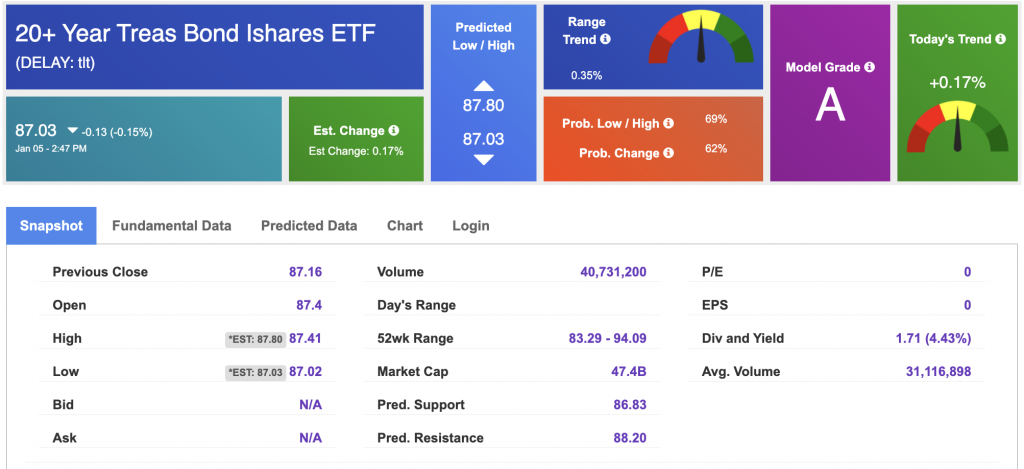
Using the iShares 20+ Year Treasury Bond ETF (TLT) as a proxy for bond prices in our Stock Forecast Tool, we see mixed signals in our 10-day prediction window. Prediction data is uploaded after the market close at 6 p.m., CST. Today’s data is based on market signals from the previous trading session.
The CBOE Volatility Index (^VIX) is priced at $14.94 at the time of publication, and our 10-day prediction window shows mixed signals. Prediction data is uploaded after the market close at 6 p.m., CST. Today’s data is based on market signals from the previous trading session.
Please share this Tradespoon Market Commentary with your friends.
![]()

![]()
Comments Off on


Tradespoon Tools make finding winning trades in minute as easy as 1-2-3.
Our simple 3 step approach has resulted in an average return of almost 20% per trade!

