 Special Offer: Get a 'Standalone' WeeklyTrader Membership for much less than the cost of the entire Elite Membership!
CLICK HERE TO LEARN MORE
Special Offer: Get a 'Standalone' WeeklyTrader Membership for much less than the cost of the entire Elite Membership!
CLICK HERE TO LEARN MORE
Last week looked and felt like a market that wants to grind higher—but refuses to hand out easy wins. Volatility stayed unusually muted with the VIX hovering near 14, yet the underlying tape was far more selective than the calm headline suggests. By Friday, the tone improved meaningfully: the S&P 500 finished up about 0.6%, the Dow gained roughly 260 points (+0.5%), and the Nasdaq added around 0.8%, pushing the major indexes back within reach of fresh closing highs.
Monday’s action reinforced the same theme: resilience, but with visible fault lines. Stocks opened under pressure after fresh headlines raised concerns about Federal Reserve independence, then gradually steadied as buyers leaned into dips. The divergence across indexes told the story—tech held up better while parts of the Dow lagged—largely because financials were on the defensive.
Under the surface, rates continued to act like the market’s “silent governor.” The 2-year yield has been pressing higher (moving into the mid-3.5% area), and the 10-year has remained elevated around the low-4% range, while still whipping around in a broad 3.6%–4.2% band over time. That’s a wide enough range to tighten or loosen financial conditions quickly—and it’s a big reason equities have had to earn each step higher even near record levels.
The biggest macro headline Monday wasn’t earnings or growth—it was institutional risk. Federal Reserve Chair Jerome Powell stated that the Justice Department served the central bank with grand jury subpoenas and threatened a criminal indictment tied to his Senate testimony last June. Powell’s message was direct: the pressure is a consequence of the Fed setting rates independently—not an issue of testimony, not an office renovation, but an attempt to challenge the idea that monetary policy is insulated from politics. Markets reacted the way they typically do when independence risk appears: the U.S. dollar weakened, yields pushed higher, and precious metals surged, with gold up sharply and silver posting an outsized jump.
That anxiety spilled into sector performance—especially financials. Banks and card networks came under additional pressure after President Donald Trump called for a one-year cap on credit card interest rates at 10%. Whether that idea ever becomes policy is almost beside the point in the short run: the market trades the risk first. And in Monday’s tape, names like Visa, JPMorgan, and American Express were meaningful drags on the Dow even as broader indexes stabilized.
Click Here to Subscribe to Our YouTube Channel So You Don’t Miss Out!
Last week’s broader narrative was dominated less by earnings and more by policy and macro crosscurrents. Tariff uncertainty stayed front and center. On Friday, equities briefly wobbled when the Supreme Court did not release a ruling tied to the administration’s use of the International Emergency Economic Powers Act for tariffs—but the weakness didn’t hold. That was an important tell: dip-buying behavior is still alive even with headline risk hanging overhead.
Geopolitics also injected real sector-level consequences. Reports of a U.S. capture of Venezuelan leader Nicolás Maduro sparked a sharp repricing in energy and oil-linked names as traders recalibrated expectations around Venezuelan supply and shipments, especially with unrest also simmering in Iran. Oil climbed around 2%, and when energy catches a bid like that, it often supports “real economy” leadership—industrials, value, and parts of the Dow—exactly the kind of broadening the market has been searching for.
A second rotation catalyst emerged mid-to-late week: President Trump’s call for a meaningfully larger future defense budget. Capital flowed toward defense and industrial names, helping diversify leadership beyond the usual mega-cap growth trade.
Finally, Friday’s December jobs report landed with a “cooling but not breaking” vibe. Payroll growth came in at 50,000 (below expectations around 55,000), while unemployment ticked down to 4.4% and November was revised lower. It’s not recessionary on its face—but it reinforces that the labor market is gradually losing heat. Consumer psychology improved modestly too, with the University of Michigan sentiment index rising to 54 from 52.9 (the highest since September), though still depressed compared with last year—an echo of ongoing cost-of-living pressure.
If I had to summarize last week in one line: resilient, but increasingly selective. When indexes sit near highs and volatility reads complacent, the market doesn’t need much of a reason to take profits—and that showed up in the rotation-heavy chop. But the more important message was how quickly buyers re-engaged after tariff jitters and how leadership started to broaden into energy, defense, and cyclical/value pockets.
At the same time, the bond market continues to keep stocks honest. Elevated yields—and the speed with which they can move—create a constant check on equity enthusiasm. In plain English: the market can still go up, but it can’t rely on “easy multiple expansion” if rates stay high. That’s why you’re seeing a tape that rewards what’s working right now rather than rewarding everything.
And Monday added a new layer: when markets sense even a hint of institutional uncertainty around the Fed, the reflex is predictable—dollar down, metals up, yields up, and a more cautious posture toward interest-rate-sensitive groups.
I’m staying in the market-neutral camp here. Momentum has softened even as indexes hover near record levels, and that combination can be deceptive. The core risk is straightforward: if rates remain higher for longer while unemployment gradually rises, confidence can leak out slowly—compressing valuations in the most expensive corners first, then spreading outward if growth expectations slip.
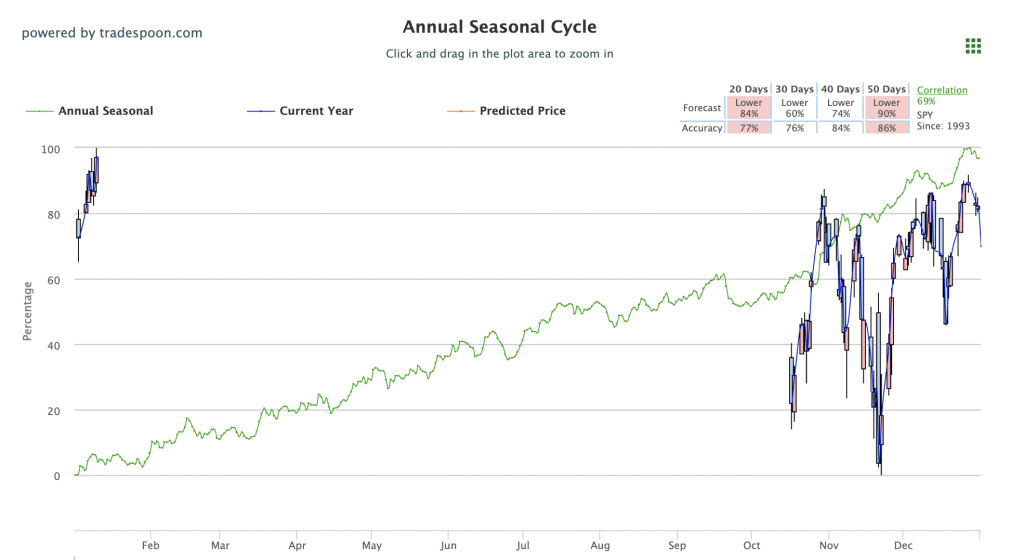
From a roadmap standpoint, I still see a path where the SPY can extend toward the $700–$720 zone, but I’m treating $650–$660 as the key near-term support band over the next few months. As long as that support holds, the longer-term trend has a foundation—but this is no longer a market that rewards complacency. It’s rewarding discipline and a punishing sloppy entries. For reference, the SPY Seasonal Chart is shown below:
Going into next week, I’m watching three things like a hawk. First, interest rates, especially the direction and speed of the 10-year—because in this environment it matters as much as any headline. Second, tariff developments, since they can shift inflation expectations and abruptly reroute sector leadership. Third, market breadth and rotation—because the healthiest rallies are the ones that keep widening participation beyond a narrow leadership group.
My playbook stays simple: keep position sizes sensible, respect support levels, and focus on the parts of the market attracting real flows—not just the loudest narratives.
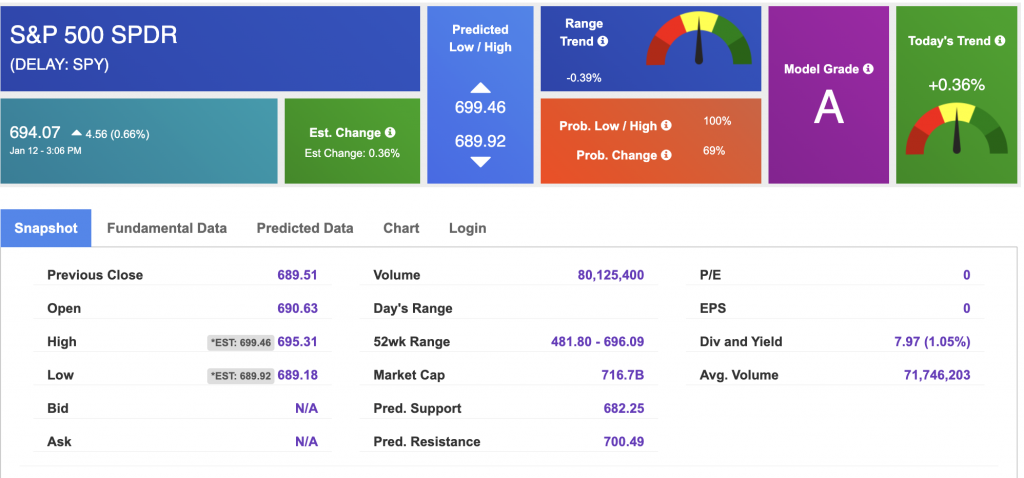
Using the “SPY” symbol to analyze the S&P 500, our 10-day prediction window shows a near-term positive outlook. Prediction data is uploaded after the market closes at 6 p.m. CST. Today’s data is based on market signals from the previous trading session.
West Texas Intermediate for Crude Oil delivery (CL.1) is priced at $59.54 per barrel, up 0.71%, at the time of publication.
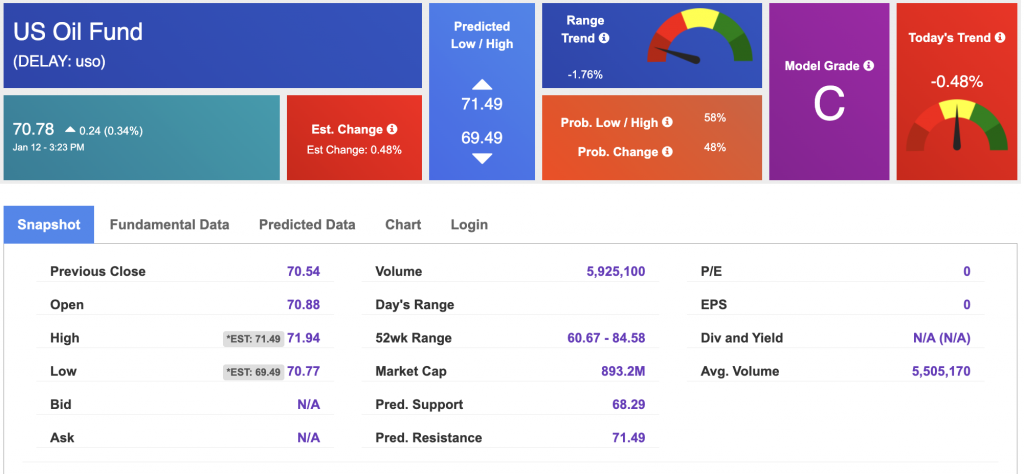
Looking at USO, a crude oil tracker, our 10-day prediction model shows mixed signals. The fund is trading at $70.78 at the time of publication. Prediction data is uploaded after the market close at 6 p.m., CST. Today’s data is based on market signals from the previous trading session.
The price for the Gold Continuous Contract (GC00) is up 2.26% at $4,602.70 at the time of publication.
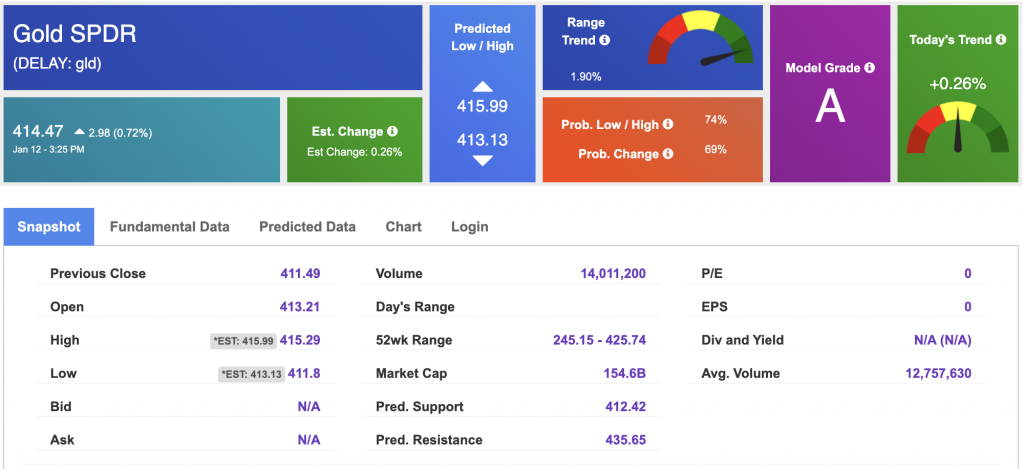
Using SPDR GOLD TRUST (GLD) as a tracker in our Stock Forecast Tool, the 10-day prediction window shows mixed signals. The gold proxy is trading at $414.47 at the time of publication. Vector signals show +0.26% for today. Prediction data is uploaded after the market close at 6 p.m., CST. Today’s data is based on market signals from the previous trading session.
The yield on the 10-year Treasury note is up at 4.192% at the time of publication.
The yield on the 30-year Treasury note is up at 4.835% at the time of publication.
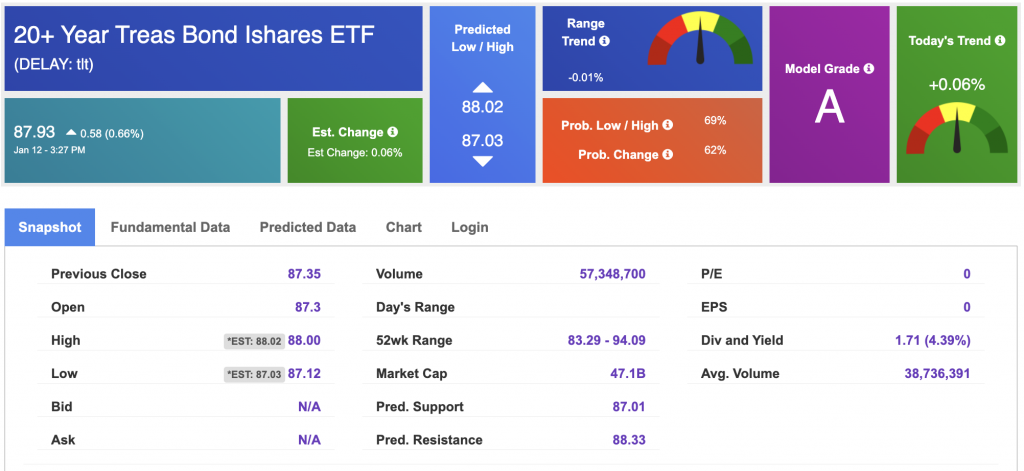
Using the iShares 20+ Year Treasury Bond ETF (TLT) as a proxy for bond prices in our Stock Forecast Tool, we see mixed signals in our 10-day prediction window. Prediction data is uploaded after the market close at 6 p.m., CST. Today’s data is based on market signals from the previous trading session.
The CBOE Volatility Index (^VIX) is priced at $15.11 at the time of publication, and our 10-day prediction window shows mixed signals. Prediction data is uploaded after the market close at 6 p.m., CST. Today’s data is based on market signals from the previous trading session.
Please share this Tradespoon Market Commentary with your friends.
![]()

![]()
Comments Off on


Tradespoon Tools make finding winning trades in minute as easy as 1-2-3.
Our simple 3 step approach has resulted in an average return of almost 20% per trade!

