 Special Offer: Try the 'RoboInvestor Membership' for ONLY $37!
CLICK HERE TO LEARN MORE
Special Offer: Try the 'RoboInvestor Membership' for ONLY $37!
CLICK HERE TO LEARN MORE
The market is searching for its footing, but the pressure underneath has not eased. Oil shocks, war-driven uncertainty, higher yields, and a critical stretch of economic data are setting up a week that could determine whether stocks are building a base or slipping toward another breakdown.
Stocks ended last week under heavy pressure, and even though Monday brought some rebound potential, the broader market still looks trapped in the same difficult environment that has been driving sentiment for weeks. The biggest issue remains the war involving Iran and the growing threat to global energy flows. That conflict has turned into far more than a geopolitical headline. It is now a direct macro force influencing oil, inflation expectations, Treasury yields, Federal Reserve policy, and overall investor confidence. As a result, this remains a market that reacts quickly to headlines but has struggled to build durable conviction.
That underlying weakness became much clearer late last week. The Dow suffered a steep selloff, the Nasdaq moved deeper into correction territory, and the broader market continued to wobble around important technical levels. High-valuation growth stocks, especially many of the biggest technology and AI-linked names, absorbed a large share of the damage. Investors have clearly become less willing to pay up for long-duration growth when the macro backdrop is turning more unstable. Elevated volatility and weak follow-through on rallies have reinforced the idea that this is no longer a broad risk-on environment. It is a much more selective tape where investors are demanding stronger fundamentals, cleaner setups, and more margin of safety.
The main driver of that shift has been oil. Last week showed just how quickly energy can reprice the entire market narrative. Crude surged on fears that the conflict could seriously disrupt flows through the Strait of Hormuz, reviving concerns about a fresh inflation shock at a time when the market was already uneasy about sticky price pressure. Then, almost as quickly, oil pulled back when President Trump suggested there was progress in talks with Iran and delayed threatened strikes. That reversal helped calm markets temporarily, but it did not solve the real problem. The bigger message was that energy markets remain extremely sensitive to every new development, and as long as that remains true, equities are likely to stay reactive as well.
Monday’s action matters because it added more detail to that picture. Futures were weak coming into the session, reflecting how cautious investors still are after last week’s slide. The rebound that followed was modest and uneven, which in many ways is the more important signal. This was not the kind of session that screamed renewed confidence. Instead, it looked more like a market trying to stabilize after getting stretched to the downside, while still keeping one eye firmly on oil, yields, and geopolitical headlines. Energy shares remained a relative area of strength, while technology leadership stayed shaky. That split continues to tell an important story about where capital feels safest right now.
Bond yields also remain central to the outlook. Last week, the 10-year Treasury yield climbed high enough to add more pressure to already fragile valuations. Even though yields eased some on Monday, the larger issue has not gone away. If oil-driven inflation risk remains elevated, the Fed has less flexibility to move toward easier policy. That creates a difficult setup for equities. Investors do not just have to worry about slowing growth anymore. They also have to worry about whether rates stay restrictive for longer than the market would like. When that happens, richly valued sectors lose some of the benefit of the doubt, and leadership tends to narrow toward areas with stronger cash flow, lower multiples, and more direct exposure to real-world pricing power.
That is why this week’s calendar matters so much. The market is entering a shortened holiday week, but it is packed with data that could meaningfully shape expectations for growth and Fed policy. Job openings data arrives Tuesday, ADP private payrolls on Wednesday, and Friday brings the March jobs report, even though the stock market will be closed for Good Friday. That detail is especially important. It means one of the week’s most important macro reports will hit when cash equities are shut, which could increase uncertainty and lead to a more cautious tone earlier in the week as traders position ahead of it.
Manufacturing data will also be important. The ISM manufacturing report should offer another look at whether business activity is continuing to soften or whether parts of the economy are still holding up despite the pressure from rates and geopolitical instability. If manufacturing disappoints while labor data also weakens, recession concerns could move higher. If the data stays firm, the market may shift back toward the view that the economy is resilient, but that same outcome could keep rate-cut hopes under pressure if inflation risks remain elevated. In other words, the data this week is unlikely to be interpreted on its own. Every report will be filtered through the same larger question: is the economy cooling in a manageable way, or is the market moving into a more uncomfortable mix of slower growth and stubborn inflation?
That is really the heart of the current setup. Investors are trying to figure out whether the economy is heading toward a soft landing, a stagflation scare, or something in between. The war with Iran has made that calculation harder because it injects a new source of inflation pressure at exactly the wrong time. Oil does not have to stay at its highs to keep markets nervous. It simply has to remain volatile enough to prevent confidence from fully returning. As long as traders know that one new headline can send crude sharply higher again, they will be less willing to chase risk aggressively.
There is also an important behavioral shift taking place beneath the surface. Investors are becoming much more selective about what they want to own. This is no longer a market where broad enthusiasm can carry nearly everything higher. Now the focus is shifting back toward balance sheet strength, margin resilience, pricing power, and realistic valuation. That tends to happen when confidence in the macro backdrop weakens. It is also why defensive areas, energy-linked names, and cash alternatives such as high-yield money market products are drawing more attention. When short-term rates are still attractive and macro uncertainty is rising, the hurdle for taking equity risk naturally gets higher.
My view remains market-neutral, but with an emphasis on caution in the near term. Monday’s rebound helps slow the bleeding, but it does not change the bigger picture yet. This still looks like a market searching for stability rather than one that has found it. For sentiment to improve in a more meaningful way, investors likely need several things to happen at once: oil needs to calm down, yields need to stop leaning on valuations, and this week’s labor and manufacturing data need to show moderation without signaling a real crack in the economy.
Until then, the better mindset is still patience, selectivity, and discipline. Relief rallies can absolutely happen in this environment, but they can also fade quickly if the macro headlines turn again. That is why this week matters so much. It may not deliver all the answers, but it should tell us a lot about whether this market still has a floor under it or whether the next leg lower is still a real risk.
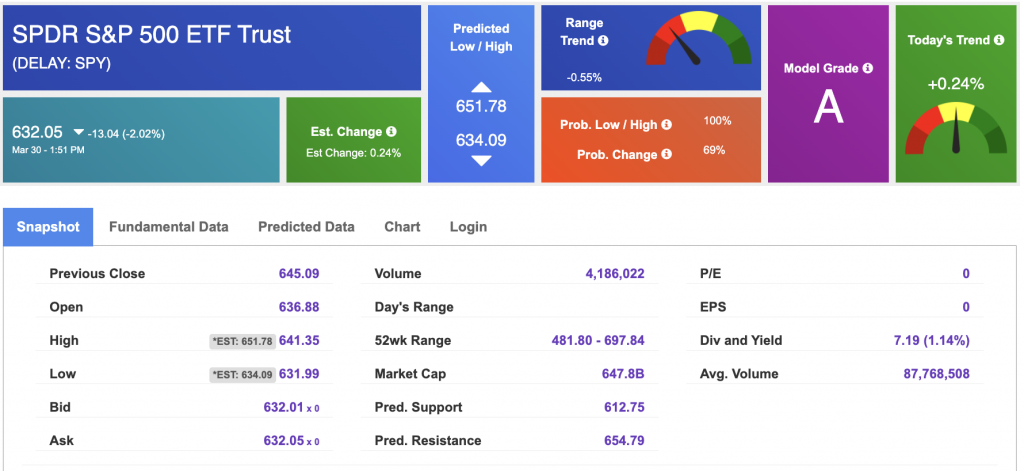
Using the “SPY” symbol to analyze the S&P 500, our 10-day prediction window shows a near-term positive outlook. Prediction data is uploaded after the market closes at 6 p.m. CST. Today’s data is based on market signals from the previous trading session.
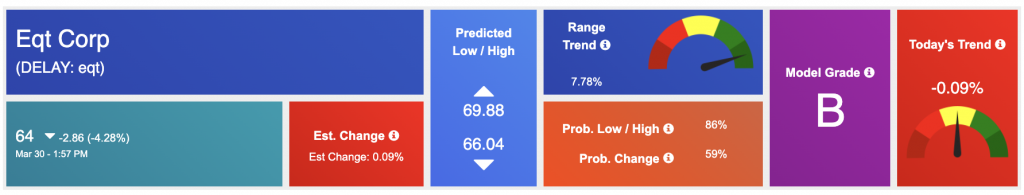
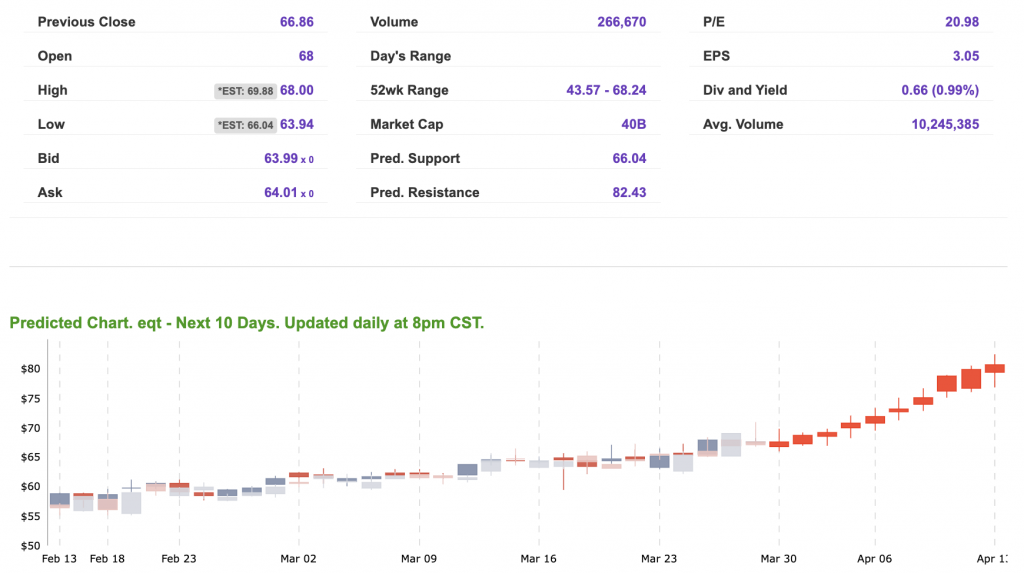
Our featured symbol for Tuesday is EQT. EQT Corp. (EQT) is showing a steady vector in our Stock Forecast Toolbox’s 10-day forecast.
The symbol is trading at $64 with a vector of -0.09% at the time of publication.
10-Day Prediction data is uploaded after the market close at 6 p.m., CST. Today’s data is based on market signals from the previous trading session.
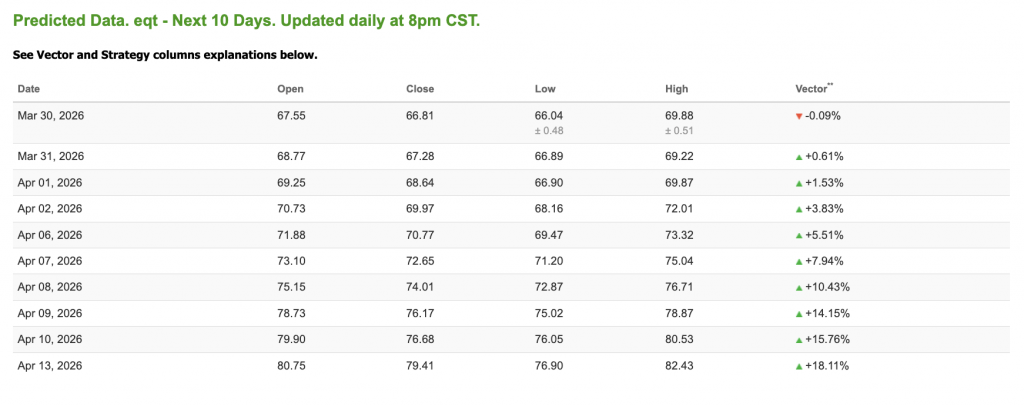
Note: The Vector column calculates the change of the Forecasted Average Price for the next trading session relative to the average of actual prices for the last trading session. The column shows the expected average price movement “Up or Down”, in percent. Trend traders should trade along the predicted direction of the Vector. The higher the value of the Vector the higher its momentum.
*Please note: At the time of publication, Vlad Karpel does have a position in the featured symbol, vlo. Our featured symbol is part of your free subscription service. It is not included in any paid Tradespoon subscription service. Vlad Karpel only trades his money in paid subscription services. If you are a paid subscriber, please review your Premium Member Picks, ActiveTrader, or MonthlyTrader recommendations. If you are interested in receiving Vlad’s picks, please click here.
West Texas Intermediate for Crude Oil delivery (CL.1) is priced at $103.33 per barrel, yp 3.70%, at the time of publication.

Looking at USO, a crude oil tracker, our 10-day prediction model shows mixed signals. The fund is trading at $128.72 at the time of publication. Prediction data is uploaded after the market close at 6 p.m., CST. Today’s data is based on market signals from the previous trading session.
The price for the Gold Continuous Contract (GC00) is down 3.77% at $4,403.70 at the time of publication.
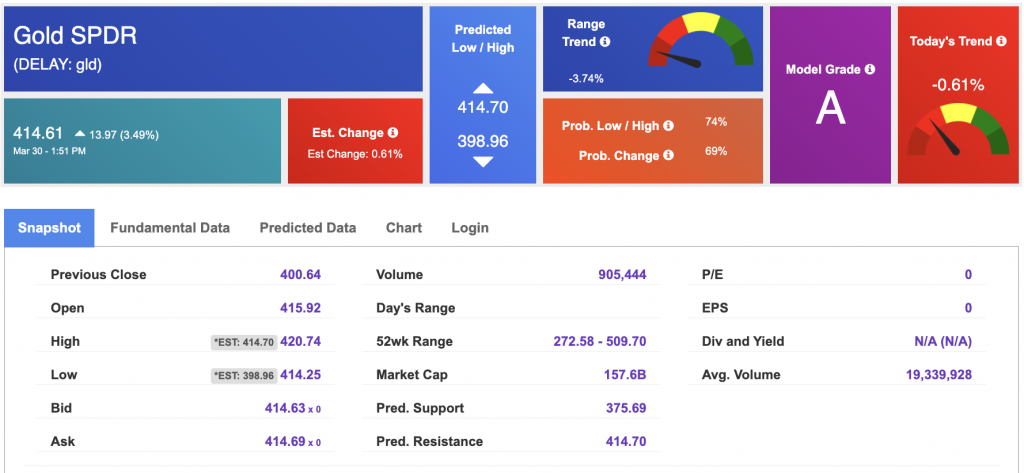
Using SPDR GOLD TRUST (GLD) as a tracker in our Stock Forecast Tool, the 10-day prediction window shows mixed signals. The gold proxy is trading at $414.61 at the time of publication. Vector signals show -0.61% for today. Prediction data is uploaded after the market close at 6 p.m., CST. Today’s data is based on market signals from the previous trading session.
The yield on the 10-year Treasury note is down at 4.347% at the time of publication.
The yield on the 30-year Treasury note is down at 4.911% at the time of publication.
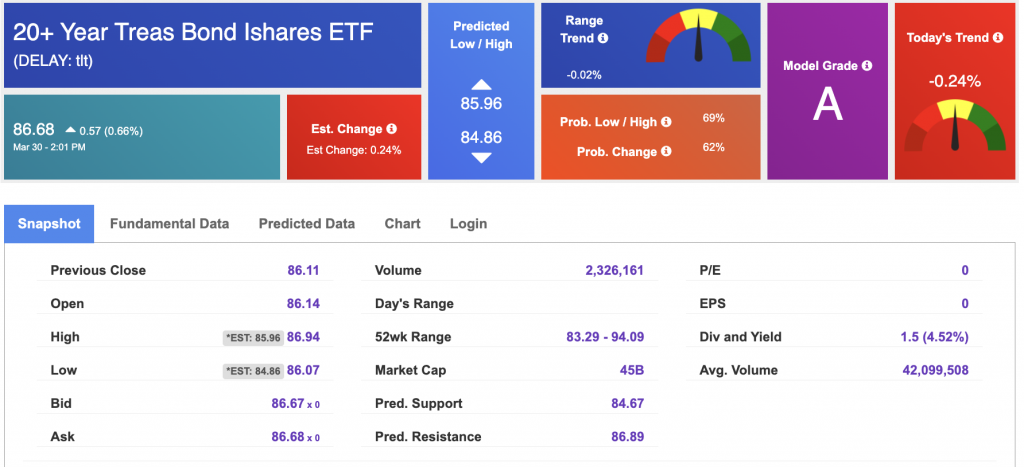
Using the iShares 20+ Year Treasury Bond ETF (TLT) as a proxy for bond prices in our Stock Forecast Tool, we see mixed signals in our 10-day prediction window. Prediction data is uploaded after the market close at 6 p.m., CST. Today’s data is based on market signals from the previous trading session.
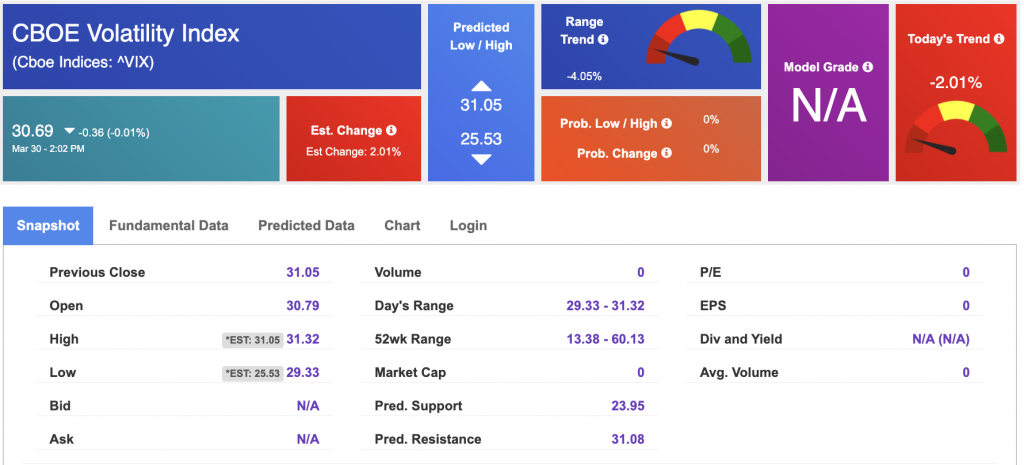
The CBOE Volatility Index (^VIX) is priced at $30.69 at the time of publication, and our 10-day prediction window shows mixed signals. Prediction data is uploaded after the market close at 6 p.m., CST. Today’s data is based on market signals from the previous trading session.
Please share this Tradespoon Market Commentary with your friends.
![]()

![]()
Comments Off on


Tradespoon Tools make finding winning trades in minute as easy as 1-2-3.
Our simple 3 step approach has resulted in an average return of almost 20% per trade!

