 Special Offer: Try the 'ShadowTrader Membership' for ONLY $37!
CLICK HERE TO LEARN MORE
Special Offer: Try the 'ShadowTrader Membership' for ONLY $37!
CLICK HERE TO LEARN MORE
Today’s market is trading like the “AI high” is wearing off. Stocks are staring at a fourth straight day of losses as a Home Depot earnings miss, softer labor data, and renewed doubts around Nvidia and generative AI all hit at once.
Stocks are starting Tuesday, November 18, on the back foot, and the market is acting like it’s finally feeling the weight of the past few weeks. The major indices are staring at a potential fourth straight day of drawdown, with the S&P 500 down about 0.6% at the open around 6,630 and the Dow off roughly 1%. The Nasdaq is weaker as well, down close to 0.9%, as buyers grow more cautious and the index grinds toward a key near-term zone between 6,630 and 6,650. This is still a range-bound tape, but you can feel the concern that momentum is slipping: dip-buying is slower, profit-taking is faster, and every data point or earnings miss gets a louder reaction than it did a few weeks ago.
The immediate pressure point this morning is the consumer. Home Depot’s report landed with a thud: adjusted earnings of $3.74 per share missed estimates, same-store sales grew just 0.2% versus expectations for 1.3%, and management cut its 2026 EPS outlook from a 2% decline to a 5% decline. That combination of a miss, softer current demand, and weaker forward guidance is exactly what this market is inclined to punish. It reinforces the idea that higher-for-longer rates and a more cautious homeowner are showing up in big-ticket spending, and it puts extra scrutiny on Walmart, Target, and other retailers set to report next. Treasuries, meanwhile, are catching a bid: the 10-year yield is down roughly 4–5 basis points, signaling a move into safety, even as classic havens like gold and the dollar fail to show the same kind of urgency.
At the same time, the AI and tech complex is again at the center of the storm. Nvidia is down another 2%-plus in early trading, extending Monday’s 1.9% slide as investors step back ahead of earnings and sentiment sours on the broader sector. Microsoft and Amazon—two of Nvidia’s largest AI customers—were both hit with downgrades on concerns that the economics of generative AI are not as lucrative as early hopes suggested. That skepticism is bleeding into the entire chip space: AMD is under pressure, the semiconductor ETF is in the red, and the market is clearly re-rating how much open-ended AI spending it is willing to fund without clearer proof of durable returns. The AI story is intact, but the “pay any price for growth” phase is over.
Layered on top of earnings and AI is a macro backdrop that quietly looks more fragile. Treasury yields are moving lower not just on a Home Depot miss, but on a broader global equity selloff and signs of softening in delayed U.S. labor data. Weekly unemployment claims, finally released after the shutdown-related data gap, ticked up to 232,000 from 219,000 in late September, with missing weeks in between reminding everyone how incomplete the picture still is. It’s not a recession print, but it is consistent with a cooler, more uneven labor market. That, in turn, reinforces the idea of a slower, data-dependent Fed rather than a rapid pivot to aggressive cuts, and it supports this cautious, risk-off tilt we’re seeing across equities.
My stance hasn’t changed, but today’s tape validates it. I remain effectively market-neutral with a constructive but guarded bias. I still see SPY as trading in a broad, actionable range—roughly 620–640 as a support band on pullbacks if fundamentals hold, and potential upside toward 680–700 if earnings and AI capex stay resilient and the Fed avoids hawkish surprises. With the index hovering closer to the middle of that band and the S&P 500 pressing into the 6,630–6,650 zone, this is not the moment to chase. Into weakness driven by headlines and single-name misses, I want to upgrade quality: stronger balance sheets, clearer cash flow, and reasonable valuations in sectors that can live with higher funding costs. Into strength, especially around crowded AI and mega-cap winners, I’d rather be trimming, right-sizing positions, and using volatility around Nvidia and the big-box retailers as an opportunity to refine the portfolio—not as an excuse to swing for the fences.
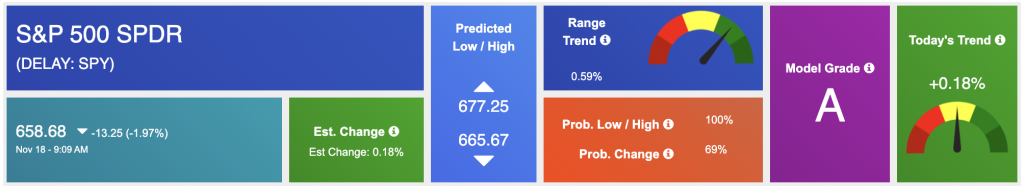
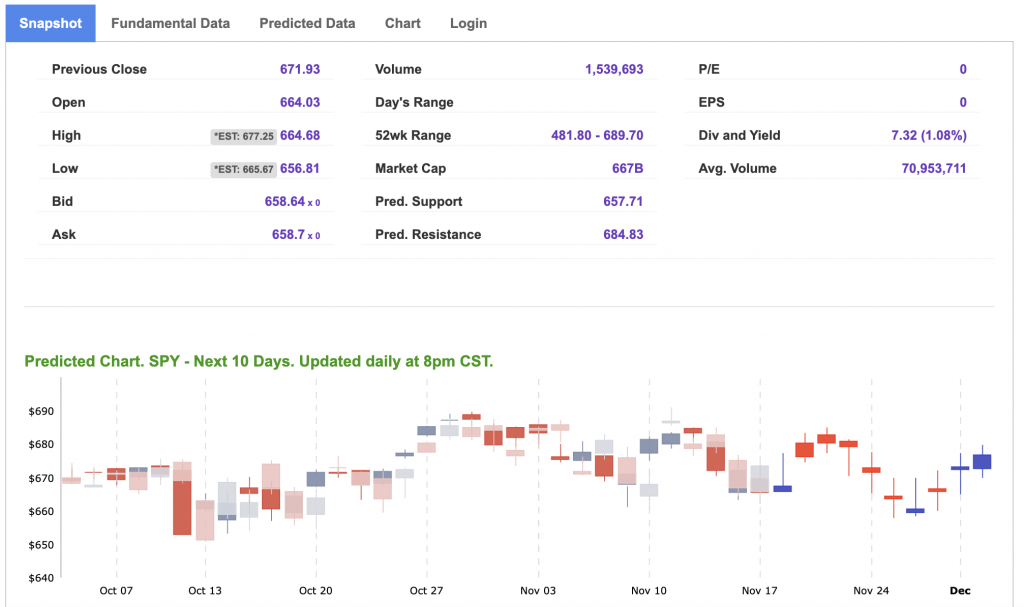
Using the “SPY” symbol to analyze the S&P 500, our 10-day prediction window shows a near-term positive outlook. Prediction data is uploaded after the market closes at 6 p.m. CST. Today’s data is based on market signals from the previous trading session.
Our featured symbol for Tuesday is XLE. Caterpillar Inc. (CAT) is showing a steady vector in our Stock Forecast Toolbox’s 10-day forecast.
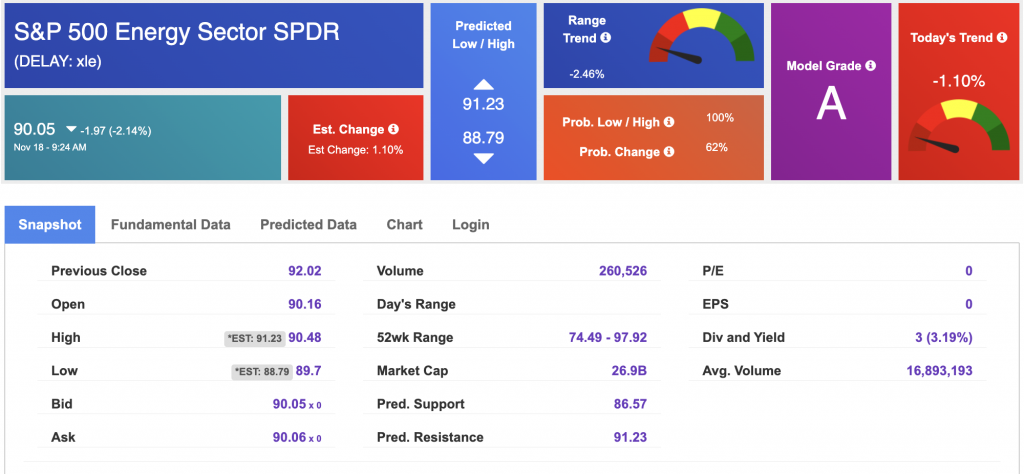
The symbol is trading at $90.05 with a vector of -1.10% at the time of publication.
10-Day Prediction data is uploaded after the market close at 6 p.m., CST. Today’s data is based on market signals from the previous trading session.
Note: The Vector column calculates the change of the Forecasted Average Price for the next trading session relative to the average of actual prices for the last trading session. The column shows the expected average price movement “Up or Down”, in percent. Trend traders should trade along the predicted direction of the Vector. The higher the value of the Vector the higher its momentum.
*Please note: At the time of publication, Vlad Karpel does have a position in the featured symbol, XLE. Our featured symbol is part of your free subscription service. It is not included in any paid Tradespoon subscription service. Vlad Karpel only trades his money in paid subscription services. If you are a paid subscriber, please review your Premium Member Picks, ActiveTrader, or MonthlyTrader recommendations. If you are interested in receiving Vlad’s picks, please click here.
West Texas Intermediate for Crude Oil delivery (CL.1) is priced at $59.64 per barrel, down 0.45%, at the time of publication.
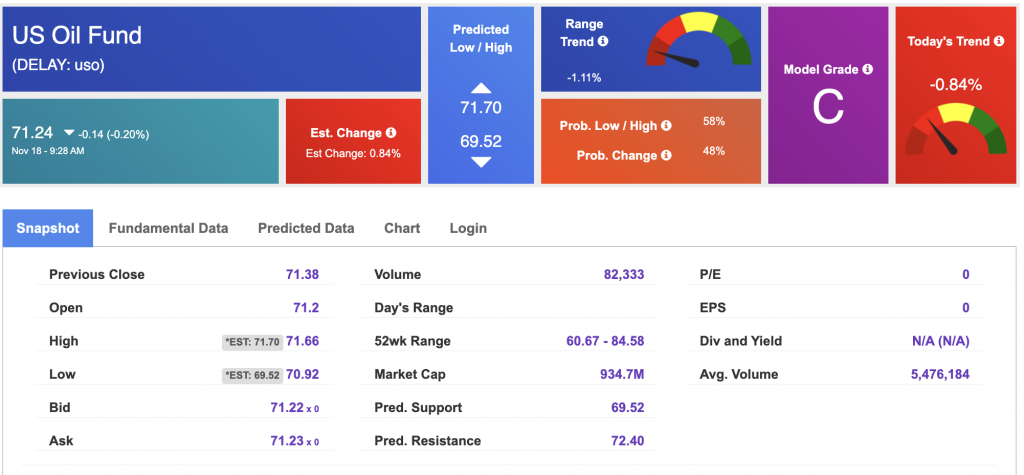
Looking at USO, a crude oil tracker, our 10-day prediction model shows mixed signals. The fund is trading at $71.24 at the time of publication. Prediction data is uploaded after the market close at 6 p.m., CST. Today’s data is based on market signals from the previous trading session.
The price for the Gold Continuous Contract (GC00) is down 0.18% at $4,067.10 at the time of publication.
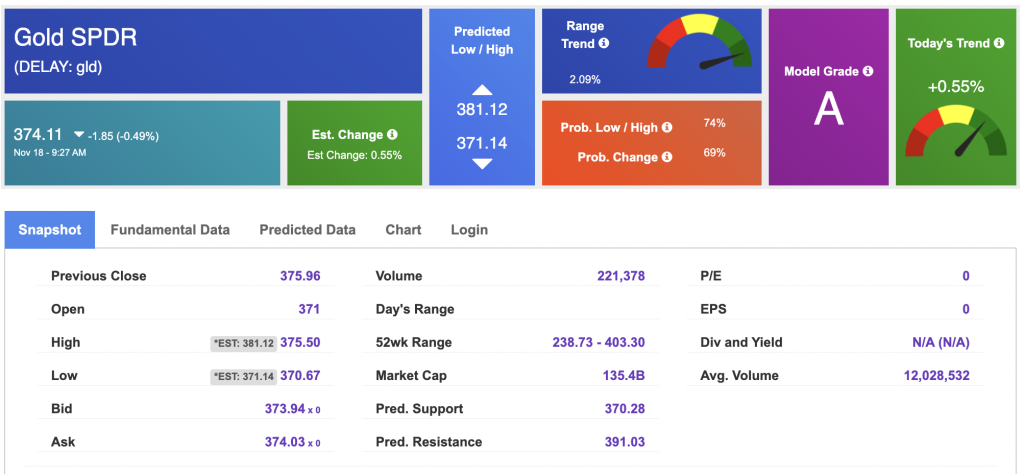
Using SPDR GOLD TRUST (GLD) as a tracker in our Stock Forecast Tool, the 10-day prediction window shows mixed signals. The gold proxy is trading at $374.11 at the time of publication. Vector signals show +0.55% for today. Prediction data is uploaded after the market close at 6 p.m., CST. Today’s data is based on market signals from the previous trading session.
The yield on the 10-year Treasury note is down at 4.102% at the time of publication.
The yield on the 30-year Treasury note is down at 4.724% at the time of publication.

Using the iShares 20+ Year Treasury Bond ETF (TLT) as a proxy for bond prices in our Stock Forecast Tool, we see mixed signals in our 10-day prediction window. Prediction data is uploaded after the market close at 6 p.m., CST. Today’s data is based on market signals from the previous trading session.
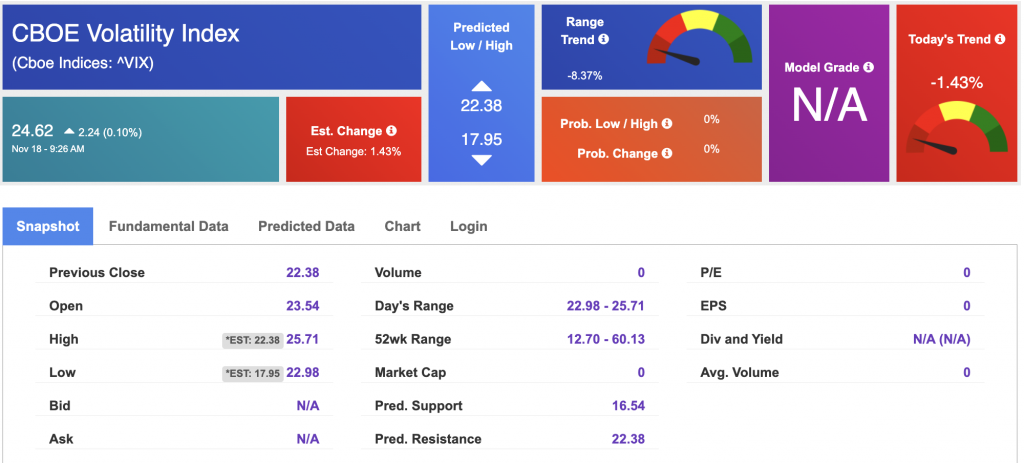
The CBOE Volatility Index (^VIX) is priced at $17.76 at the time of publication, and our 10-day prediction window shows mixed signals. Prediction data is uploaded after the market close at 6 p.m., CST. Today’s data is based on market signals from the previous trading session.
Please share this Tradespoon Market Commentary with your friends.
![]()

![]()
Comments Off on


Tradespoon Tools make finding winning trades in minute as easy as 1-2-3.
Our simple 3 step approach has resulted in an average return of almost 20% per trade!

