 Special Offer: Try the 'Elite Trading Circle Membership' for ONLY $37!
CLICK HERE TO LEARN MORE
Special Offer: Try the 'Elite Trading Circle Membership' for ONLY $37!
CLICK HERE TO LEARN MORE
The major U.S. stock indices experienced gains today, with the tech sector leading the way. Investors are closely watching the Federal Reserve’s two-day monetary policy meeting scheduled for Tuesday and Wednesday. While expectations lean towards a pause in interest rate hikes, the release of inflation data on Tuesday could potentially alter the central bank’s decision. The market’s optimistic sentiment propelled the S&P 500 to a fresh 52-week high on Monday. U.S. stock futures experienced early gains on Monday in anticipation of the Federal Reserve pausing its campaign of interest-rate increases, a move expected for the first time in over a year.
As the week progresses, investors will also monitor various economic indicators, including PPI data, retail sales, import price index, industrial production, and consumer sentiment.
Consumer Inflation Expectations and Data: According to a recent survey conducted by the New York Fed, consumer expectations for inflation in the one-year-ahead horizon decreased to 4.1% in May, reaching its lowest level in two years. April’s reading stood at 4.45%. Tuesday’s release of the May consumer price index will be closely watched, considering that consumer prices rose 4.9% year-over-year in April, indicating a slight slowdown from the 5% pace observed in March. The Federal Reserve will take these inflation figures into account when deciding on future interest-rate hikes.
Oil Prices and Global Demand Concerns: Early Monday, oil prices declined due to concerns surrounding global demand. Brent crude, the international benchmark, fell 2.4% to $72.97 per barrel, while West Texas Intermediate, the US standard, dropped 2.8% to $68.20 per barrel. Both contracts experienced declines for the second consecutive week.
Outlook and Expert Analysis: Some market experts maintain a stance in the hard landing camp, citing the impact of high-interest rates and a historically strong US dollar. While short-term expectations suggest the bulls will maintain their position near December lows, the upcoming earnings season might lead to testing and potentially breaking 52-week lows in the coming months.
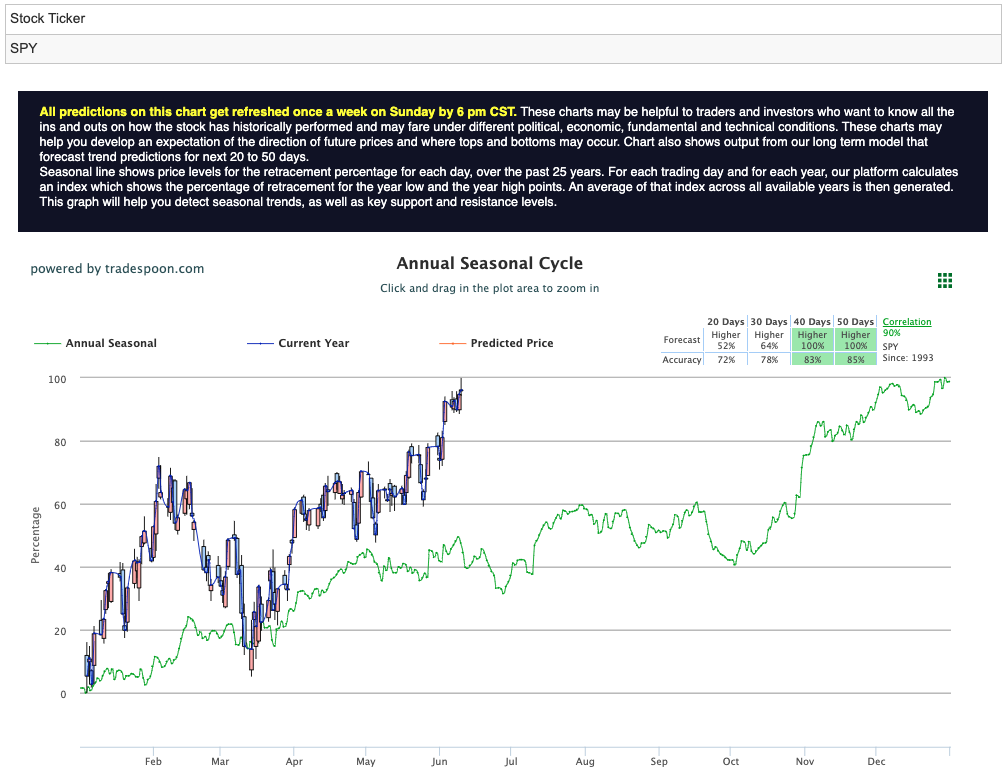
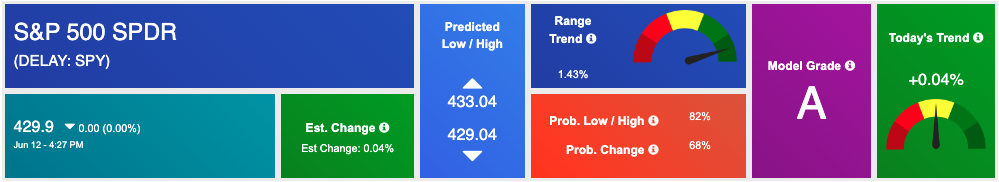
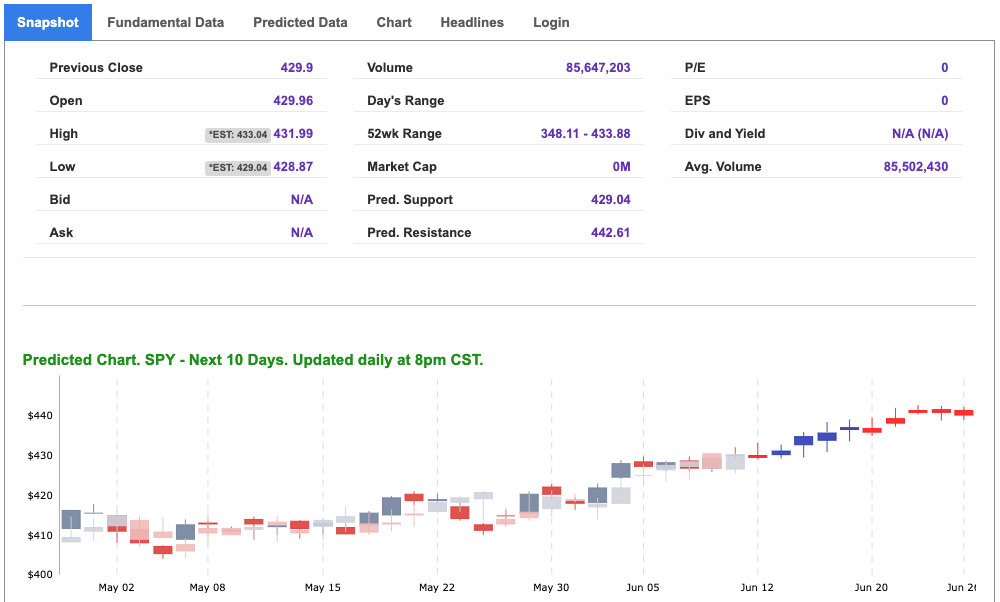
Regarding the SPY (S&P 500 ETF), experts believe that any rally is likely to be limited to levels around $430-435, with short-term support expected within the range of 375-350 in the next few months. Futures data already suggests a high probability of a 25 basis point rate hike during the June meeting. Consequently, a bearish outlook prevails going into the summer. For reference, the SPY Seasonal Chart is shown below:
Conclusion: As the market eagerly awaits the Federal Reserve’s interest rate announcement and assesses inflation data, tech stocks have driven the US indices higher. Investors are also keeping a close eye on economic indicators to gauge the market’s direction. Concerns over global demand have impacted oil prices, while experts express cautious sentiments and predict potential market lows in the months ahead.
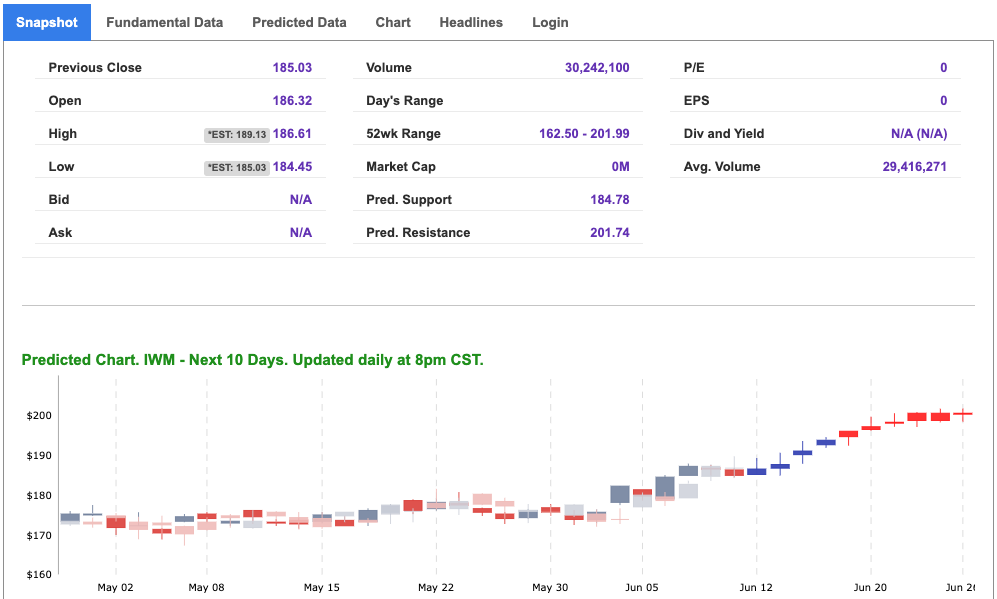
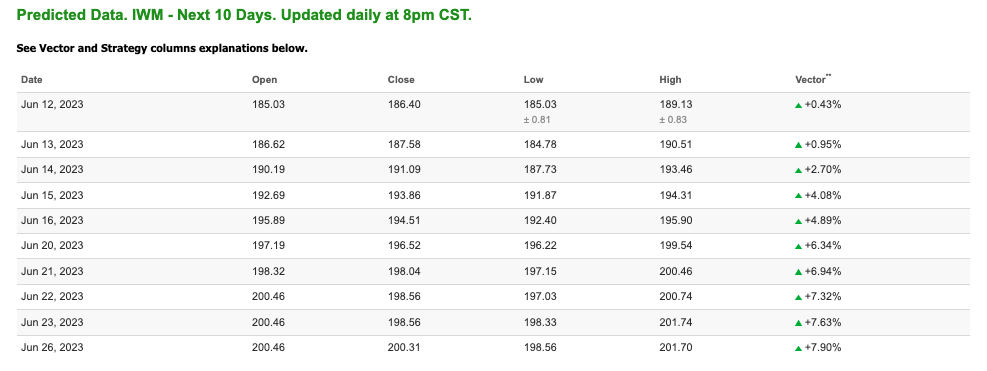
Note: The Vector column calculates the change of the Forecasted Average Price for the next trading session relative to the average of actual prices for the last trading session. The column shows the expected average price movement “Up or Down”, in percent. Trend traders should trade along the predicted direction of the Vector. The higher the value of the Vector the higher its momentum.
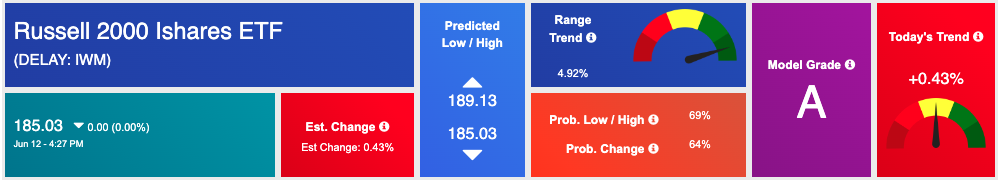
*Please note: At the time of publication Vlad Karpel does have a position in the featured symbol, IWM. Our featured symbol is part of your free subscription service. It is not included in any paid Tradespoon subscription service. Vlad Karpel only trades his money in paid subscription services. If you are a paid subscriber, please review your Premium Member Picks, ActiveTrader, or MonthlyTrader recommendations. If you are interested in receiving Vlad’s picks, please click here.
West Texas Intermediate for Crude Oil delivery (CL.1) is priced at $67.34 per barrel, down 4.03%, at the time of publication.
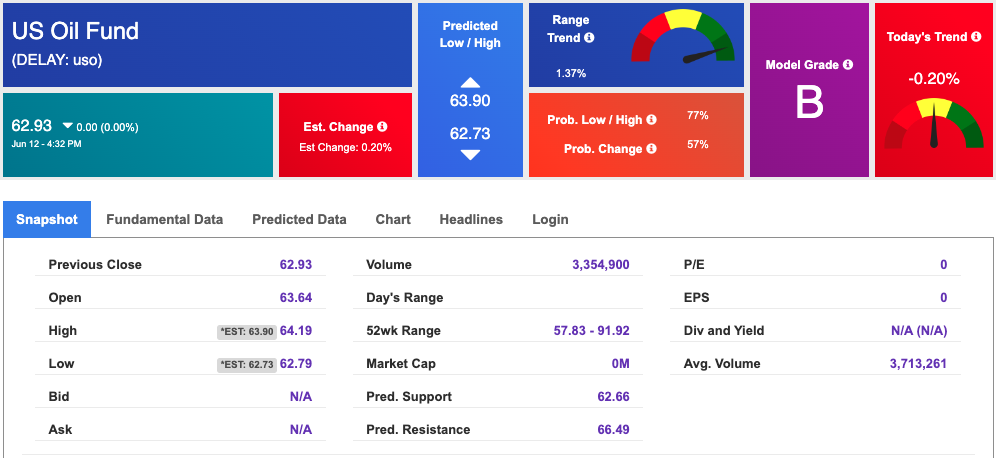
Looking at USO, a crude oil tracker, our 10-day prediction model shows mixed signals. The fund is trading at $62.93 at the time of publication. Prediction data is uploaded after the market close at 6 p.m., CST. Today’s data is based on market signals from the previous trading session.
The price for the Gold Continuous Contract (GC00) is down 0.27% at $1971.80 at the time of publication.
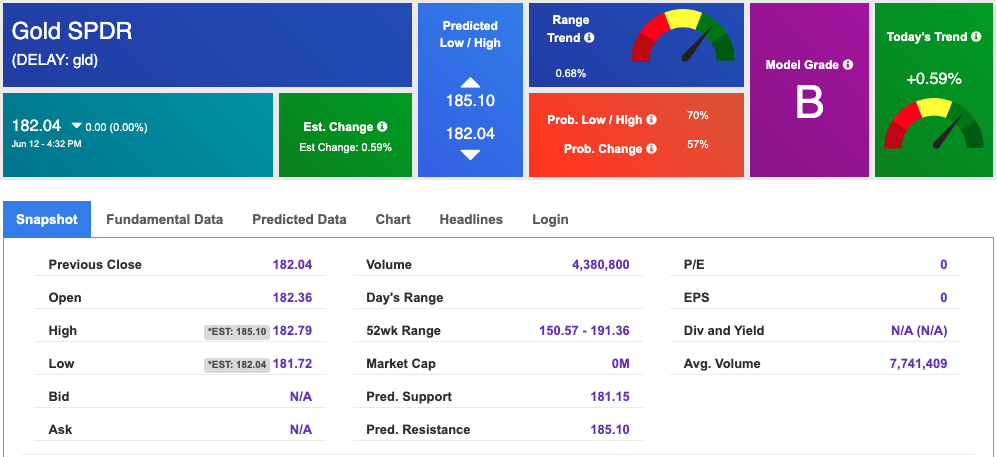
Using SPDR GOLD TRUST (GLD) as a tracker in our Stock Forecast Tool, the 10-day prediction window shows mixed signals. The gold proxy is trading at $182.04 at the time of publication. Vector signals show +0.59% for today. Prediction data is uploaded after the market close at 6 p.m., CST. Today’s data is based on market signals from the previous trading session.
The yield on the 10-year Treasury note is down at 3.740% at the time of publication.
The yield on the 30-year Treasury note is flat at 3.883% at the time of publication.
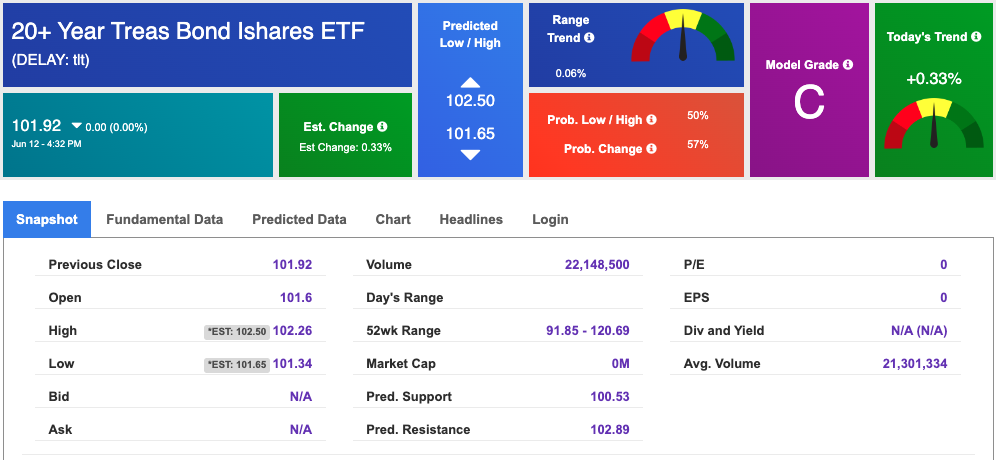
Using the iShares 20+ Year Treasury Bond ETF (TLT) as a proxy for bond prices in our Stock Forecast Tool, we see mixed signals in our 10-day prediction window. Prediction data is uploaded after the market close at 6 p.m., CST. Today’s data is based on market signals from the previous trading session.
The CBOE Volatility Index (^VIX) is $15.01 at the time of publication, and our 10-day prediction window shows mixed signals. Prediction data is uploaded after the market close at 6 p.m., CST. Today’s data is based on market signals from the previous trading session.
Please share this Tradespoon Market Commentary with your friends.
![]()

![]()
Comments Off on


Tradespoon Tools make finding winning trades in minute as easy as 1-2-3.
Our simple 3 step approach has resulted in an average return of almost 20% per trade!

