 Are you a Long-Term Trader? Then take a look at our NEW RoboInvestor Service?
CLICK HERE TO LEARN MORE
Are you a Long-Term Trader? Then take a look at our NEW RoboInvestor Service?
CLICK HERE TO LEARN MORE
In a reversal of earlier gains, stocks closed in negative territory on Monday, primarily driven by a pullback in the technology sector. The S&P 500, which had been on the cusp of reaching a significant milestone, experienced a 0.2% decline, while the Nasdaq Composite fell 0.1%. The Dow Jones Industrial Average also recorded a 0.6% drop. Investor attention was split between the impending Federal Reserve interest-rate decision and the release of the ISM services purchasing managers’ index (PMI) for May, along with the S&P U.S. services PMI for the previous month.
The stumble of these two indexes was chiefly attributed to Apple relinquishing its earlier gains, which had propelled the tech giant close to the remarkable $3 trillion market capitalization mark. Apple made waves during its annual Worldwide Developers Conference by unveiling its much-anticipated mixed-reality headset. The stock surged to a new all-time high on Monday, positioning Apple as a potential record-breaking company, poised to become the first to surpass $3 trillion in market value.
Investors are now eagerly anticipating the next interest-rate decision from the Federal Reserve, following last week’s employment data that raised doubts about the central bank pausing its tightening cycle at the upcoming monetary policy committee meeting. Additionally, we are closely monitoring developments between OPEC+ and Russia regarding oil production.
On Monday morning, data revealed a slowdown in the U.S. services sector. The Institute for Supply Management’s services index for May fell to a reading of 50.3, below the consensus expectation of 52 and a decline from April’s 51.9. While a reading above 50 indicates growth in the services industry, May’s figure indicates softer expansion. Despite consistently high inflation, the services sector remained resilient as consumers continued spending on travel and dining. However, the lackluster reading from the widely-watched ISM report suggests a possible decline in the demand for services. The 2-year Treasury yield dipped to 4.462% from Friday’s 4.5%, signaling investor speculation that the Federal Reserve might slow down its pace of interest-rate hikes at its upcoming meeting.
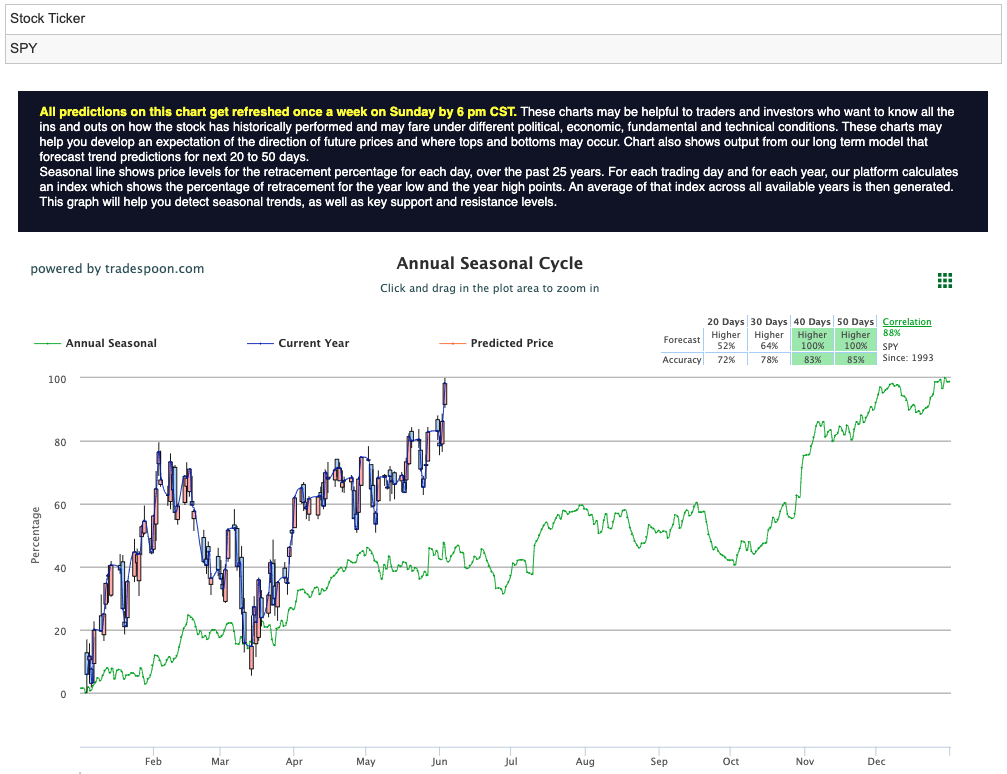
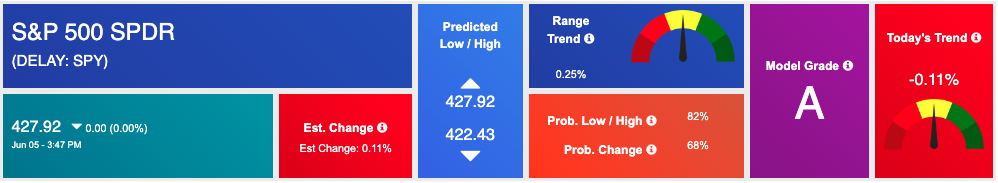
The market is currently eyeing several key events that could influence its next move. Earnings reports from companies like DOCU, SFIX, and CIEN, along with the ISM Services Data, will be closely watched. Additionally, the $VIX, a measure of market volatility, is trading near the $15 level. Technical analysis suggests that the SPY, an ETF tracking the S&P 500, faces resistance at $430 and $437, while support levels are identified at $424 and $418. Expectations point to a sideways trading pattern in the market over the next 2-8 weeks. With a bearish outlook, readers are encouraged to consider hedging their positions during this time. For reference, the SPY Seasonal Chart is shown below:
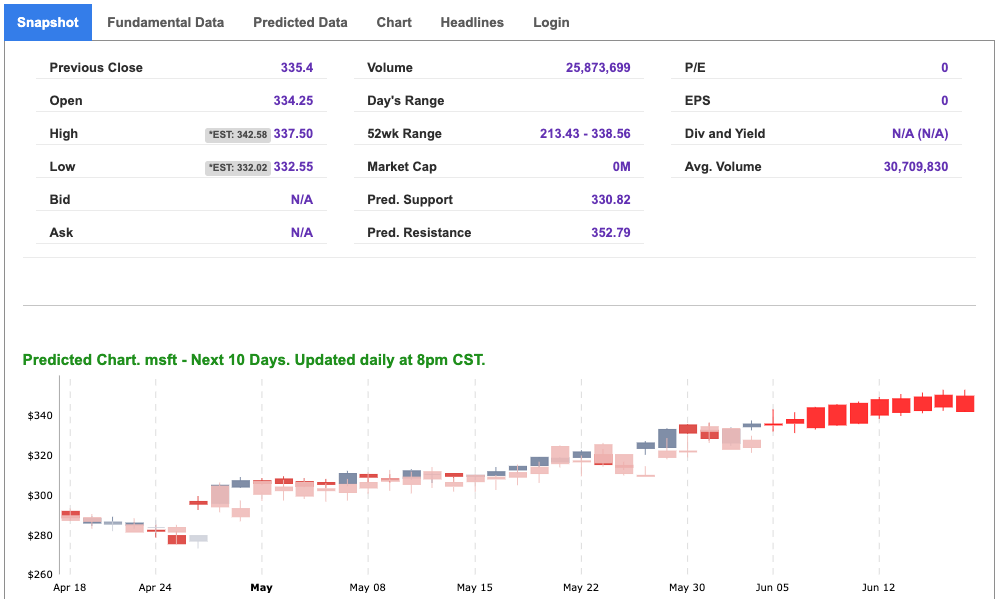
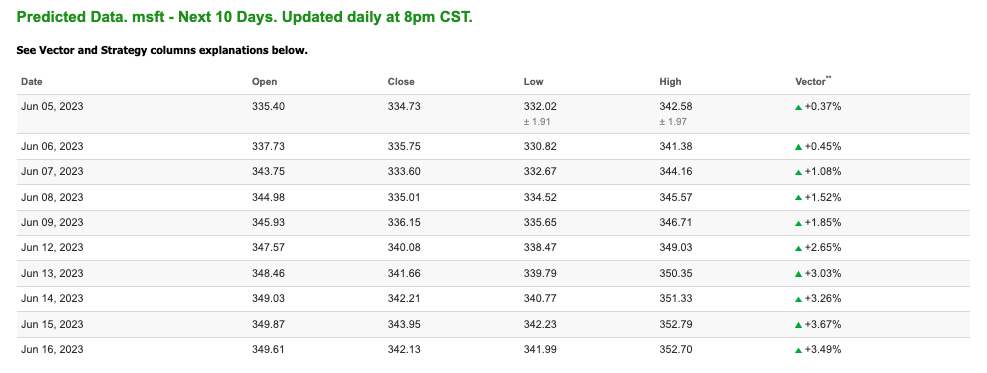
Note: The Vector column calculates the change of the Forecasted Average Price for the next trading session relative to the average of actual prices for the last trading session. The column shows the expected average price movement “Up or Down”, in percent. Trend traders should trade along the predicted direction of the Vector. The higher the value of the Vector the higher its momentum.
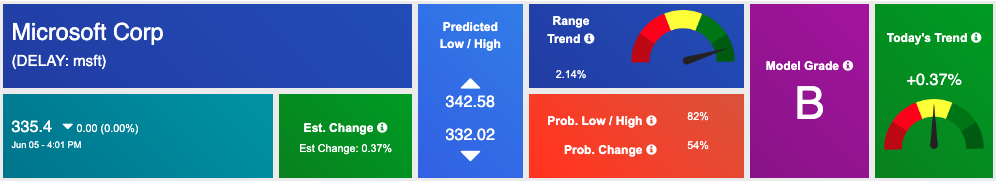
*Please note: At the time of publication Vlad Karpel does have a position in the featured symbol, msft. Our featured symbol is part of your free subscription service. It is not included in any paid Tradespoon subscription service. Vlad Karpel only trades his money in paid subscription services. If you are a paid subscriber, please review your Premium Member Picks, ActiveTrader, or MonthlyTrader recommendations. If you are interested in receiving Vlad’s picks, please click here.
West Texas Intermediate for Crude Oil delivery (CL.1) is priced at $71.81 per barrel, up 0.36%, at the time of publication.
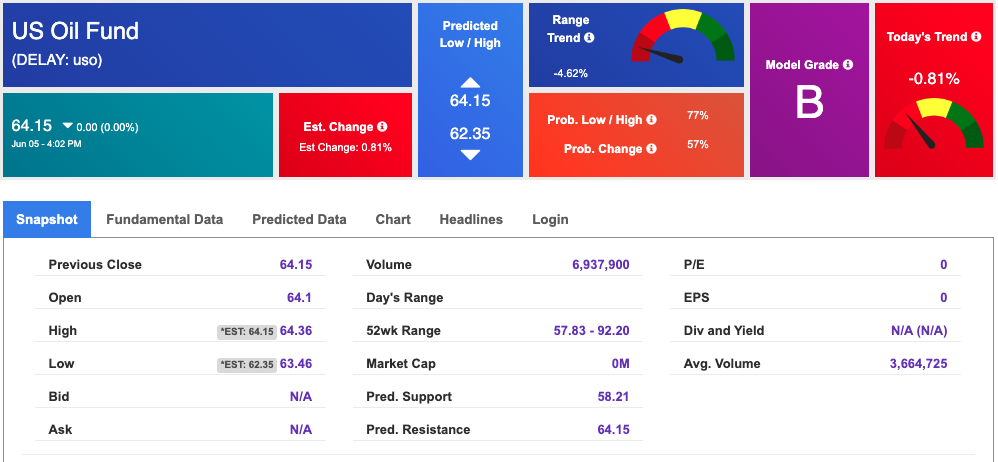
Looking at USO, a crude oil tracker, our 10-day prediction model shows mixed signals. The fund is trading at $64.15 at the time of publication. Prediction data is uploaded after the market close at 6 p.m., CST. Today’s data is based on market signals from the previous trading session.
The price for the Gold Continuous Contract (GC00) is down 0.37% at $1974.20 at the time of publication.
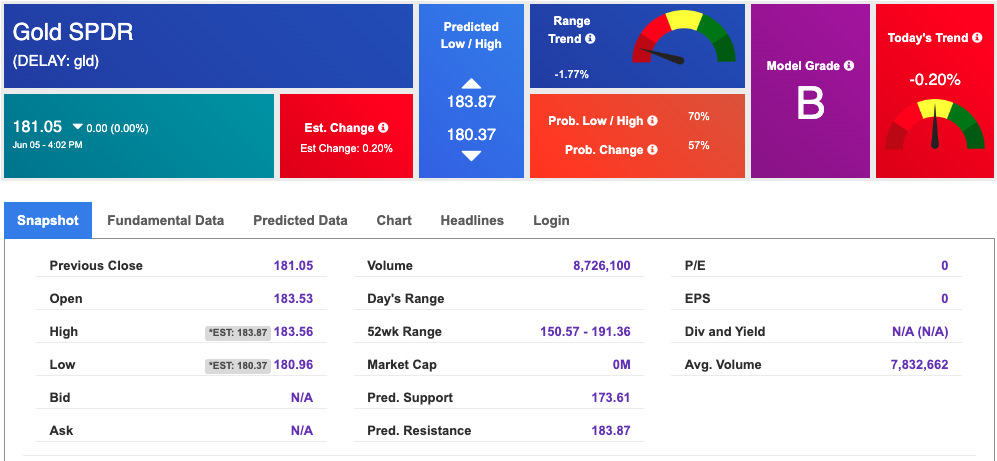
Using SPDR GOLD TRUST (GLD) as a tracker in our Stock Forecast Tool, the 10-day prediction window shows mixed signals. The gold proxy is trading at $181.05 at the time of publication. Vector signals show -0.20% for today. Prediction data is uploaded after the market close at 6 p.m., CST. Today’s data is based on market signals from the previous trading session.
The yield on the 10-year Treasury note is down at 3.688% at the time of publication.
The yield on the 30-year Treasury note is up at 3.889% at the time of publication.
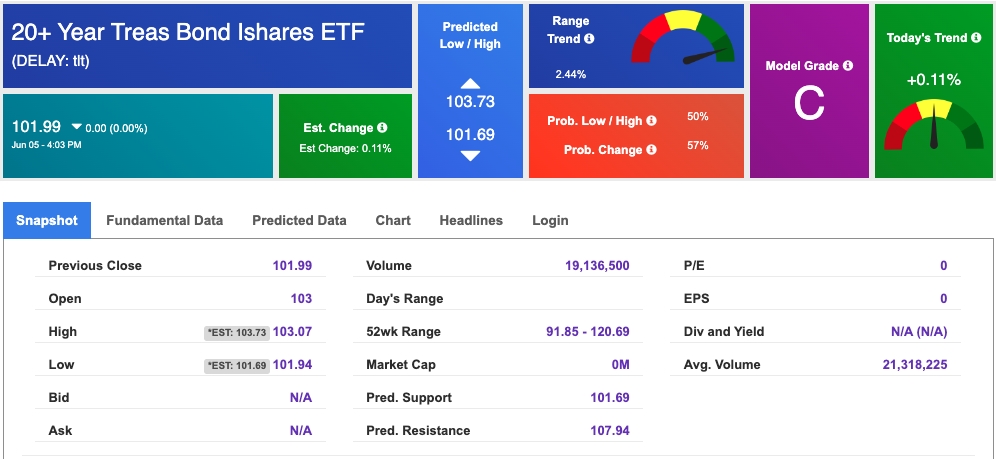
Using the iShares 20+ Year Treasury Bond ETF (TLT) as a proxy for bond prices in our Stock Forecast Tool, we see mixed signals in our 10-day prediction window. Prediction data is uploaded after the market close at 6 p.m., CST. Today’s data is based on market signals from the previous trading session.
The CBOE Volatility Index (^VIX) is $14.73 at the time of publication, and our 10-day prediction window shows mixed signals. Prediction data is uploaded after the market close at 6 p.m., CST. Today’s data is based on market signals from the previous trading session.
Please share this Tradespoon Market Commentary with your friends.
![]()

![]()
Comments Off on


Tradespoon Tools make finding winning trades in minute as easy as 1-2-3.
Our simple 3 step approach has resulted in an average return of almost 20% per trade!

