 Special Offer: Try the 'Elite Trading Circle Membership' for ONLY $37!
CLICK HERE TO LEARN MORE
Special Offer: Try the 'Elite Trading Circle Membership' for ONLY $37!
CLICK HERE TO LEARN MORE
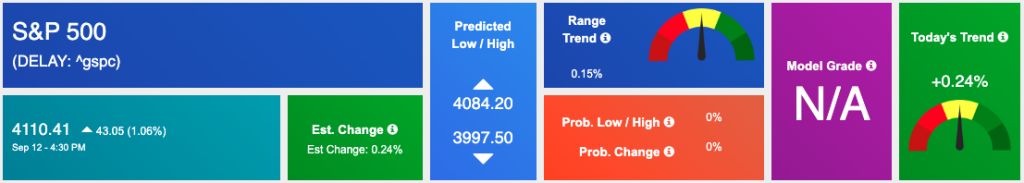
U.S. equities closed higher for a fourth consecutive session ahead of the August inflation report due Tuesday. Along with the CPI data, the $ORCL and $ADBE earnings can influence the next move in the market. With the latest upswing in the market- having snapped a multi-week streak of declines last Friday when U.S. indices booked weekly positive gains- it appears the market is prepared for a 75 basis points rate hike which the Fed will likely announce next week. Along with all three major U.S. indices booking gains, oil and gold were able to finish in positive territory while the dollar marginally slipped.
There appears to be some optimism that the August U.S. consumer prices report due Tuesday will have a negative reading month-on-month, solidifying the notion inflation has peaked and the Fed is unlikely to hike borrowing costs beyond the 4% level currently priced by markets. Additional key inflation data will follow the CPI report with producer price data on Wednesday. Retail sales, import price index, industrial production index, and capacity utilization reports for August will release on Thursday while next week look out for the latest Federal Open Market Committee meeting, set to take place September 20-21st.
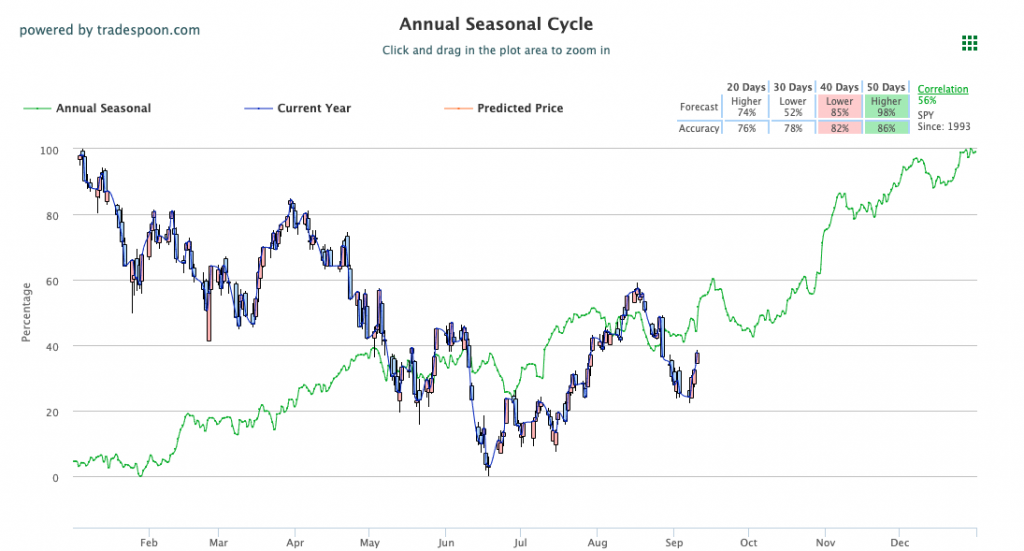
We are watching the overhead resistance levels in the SPY, which are presently at $417 and then $421. The $SPY support is at $390 and then $380 and we expect the market to continue the latest pullback within the next 2-8 weeks. We would be a seller into any further rallies and encourages subscribers not to chase the market at these levels. Globally, both Asian and European markets closed with mixed results while the VIX traded higher, near the $28 level. We encourage all market commentary readers to maintain clearly defined stop levels for all positions. For reference, the SPY Seasonal Chart is shown below:
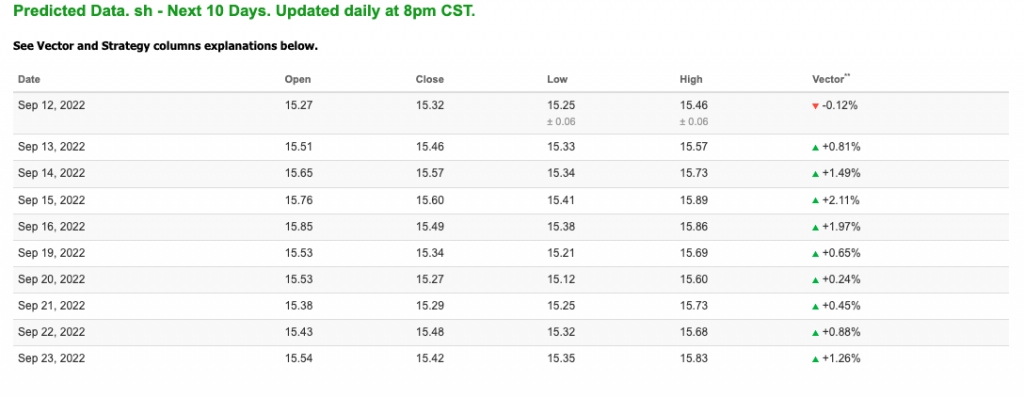
Note: The Vector column calculates the change of the Forecasted Average Price for the next trading session relative to the average of actual prices for the last trading session. The column shows the expected average price movement “Up or Down”, in percent. Trend traders should trade along the predicted direction of the Vector. The higher the value of the Vector the higher its momentum.
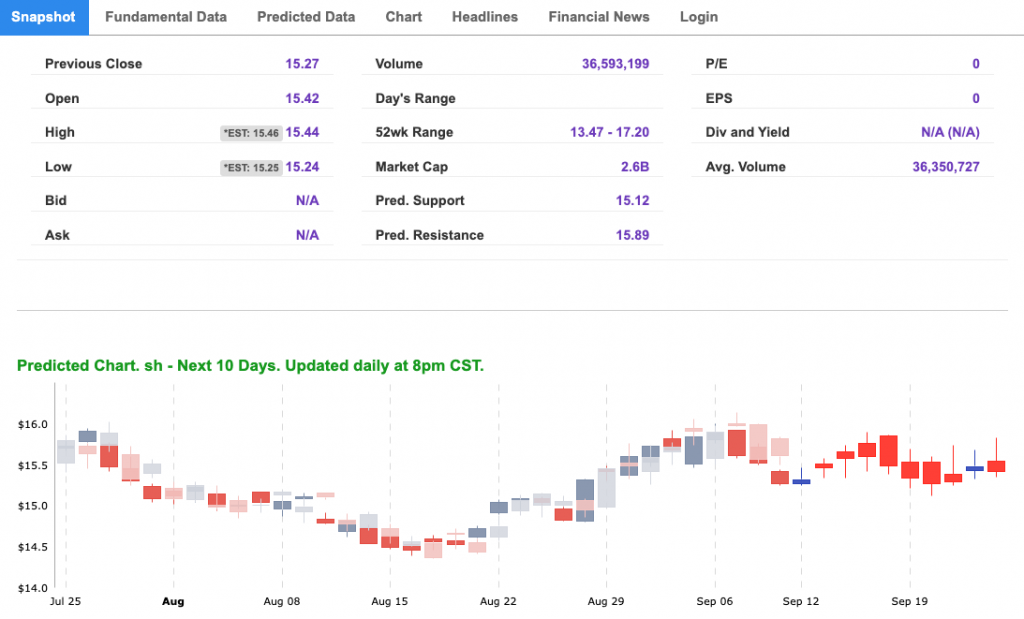
*Please note: At the time of publication Vlad Karpel does have a position in the featured symbol, SH. Our featured symbol is part of your free subscription service. It is not included in any paid Tradespoon subscription service. Vlad Karpel only trades his money in paid subscription services. If you are a paid subscriber, please review your Premium Member Picks, ActiveTrader, or MonthlyTrader recommendations. If you are interested in receiving Vlad’s picks, please click here.
West Texas Intermediate for Crude Oil delivery (CL.1) is priced at $88.04 per barrel, up 1.44%, at the time of publication.
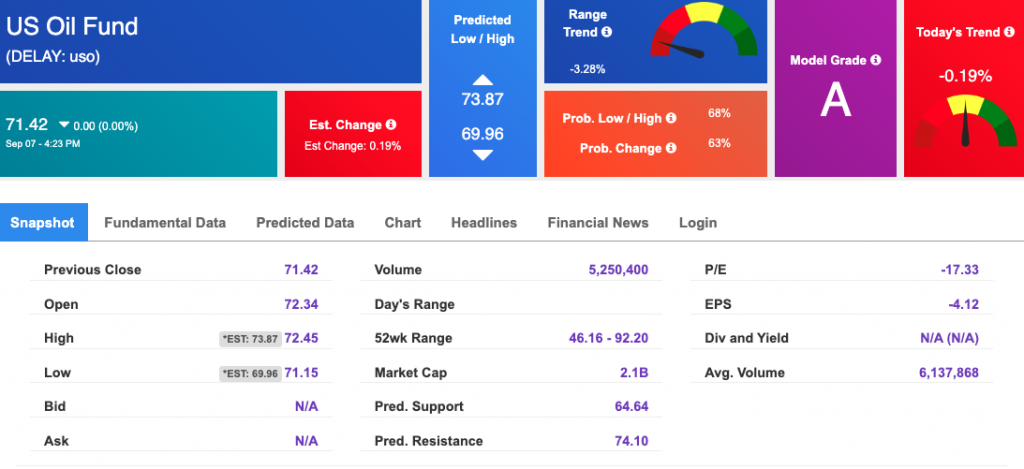
Looking at USO, a crude oil tracker, our 10-day prediction model shows mixed signals. The fund is trading at $71.42 at the time of publication. Prediction data is uploaded after the market close at 6 p.m., CST. Today’s data is based on market signals from the previous trading session.
The price for the Gold Continuous Contract (GC00) is up 0.39% at $1735.40 at the time of publication.
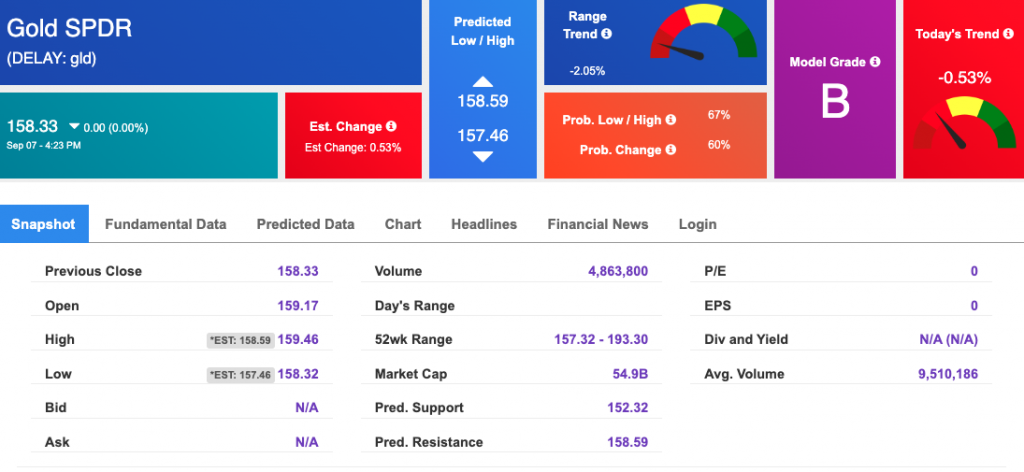
Using SPDR GOLD TRUST (GLD) as a tracker in our Stock Forecast Tool, the 10-day prediction window shows mixed signals. The gold proxy is trading at $158.33 at the time of publication. Vector signals show -0.53% for today. Prediction data is uploaded after the market close at 6 p.m., CST. Today’s data is based on market signals from the previous trading session.
The yield on the 10-year Treasury note is down, at 3.358% at the time of publication.
The yield on the 30-year Treasury note is down, at 3.515% at the time of publication.
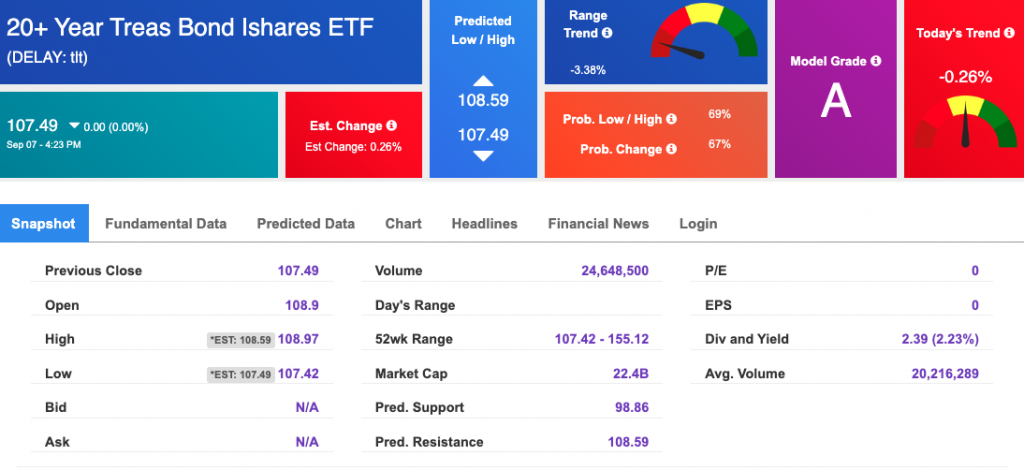
Using the iShares 20+ Year Treasury Bond ETF (TLT) as a proxy for bond prices in our Stock Forecast Tool, we see mixed signals in our 10-day prediction window. Prediction data is uploaded after the market close at 6 p.m., CST. Today’s data is based on market signals from the previous trading session.
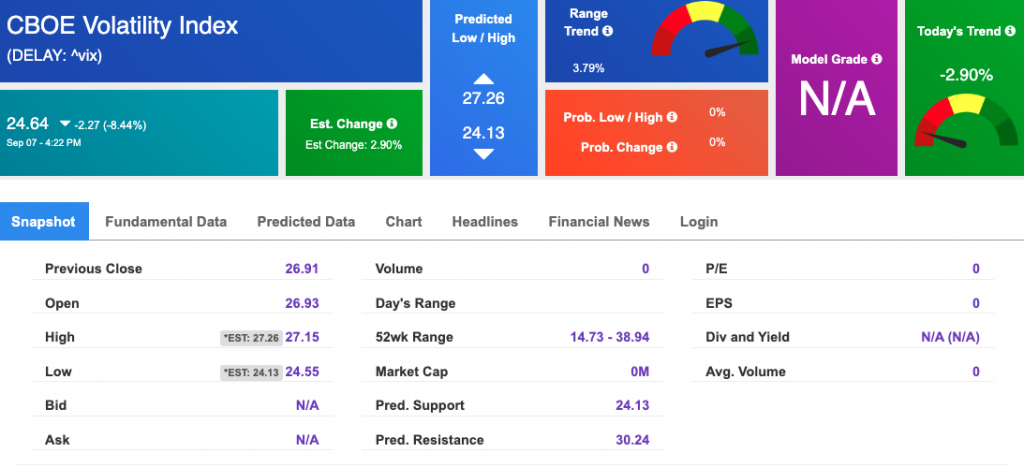
The CBOE Volatility Index (^VIX) is $24.64 at the time of publication, and our 10-day prediction window shows mixed signals. Prediction data is uploaded after the market close at 6 p.m., CST. Today’s data is based on market signals from the previous trading session.
Please share this Tradespoon Market Commentary with your friends.
![]()

![]()
Comments Off on


Tradespoon Tools make finding winning trades in minute as easy as 1-2-3.
Our simple 3 step approach has resulted in an average return of almost 20% per trade!