 Are you a Long-Term Trader? Then take a look at our NEW RoboInvestor Service?
CLICK HERE TO LEARN MORE
Are you a Long-Term Trader? Then take a look at our NEW RoboInvestor Service?
CLICK HERE TO LEARN MORE
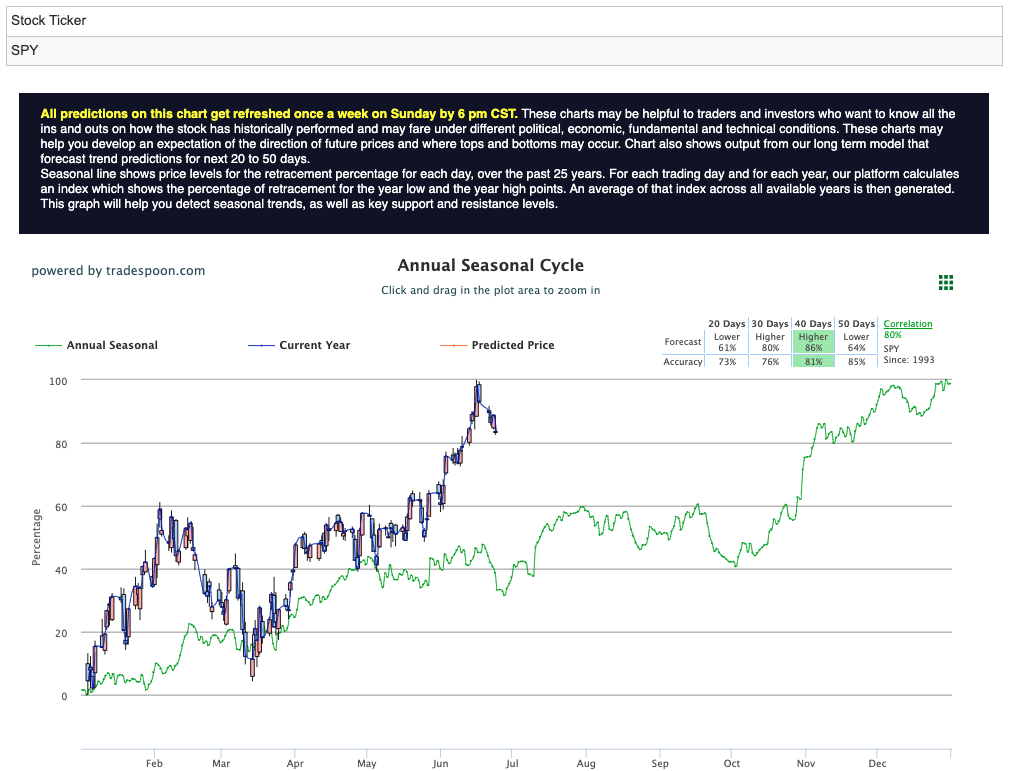
In a trading session marked by lackluster performance, the stock market faced headwinds on Monday as tech stocks bore the brunt of selling pressure. Key support levels for the SPY at $431-$432 were tested, while the market struggled to overcome overhead resistance at $434. Our market models indicate a looming negative trend, suggesting a potential overbought scenario. For reference, the SPY Seasonal Chart is shown below:
With Q2 wrapping this week and heading into the second half of 2023, investors are watching for a flurry of upcoming earnings reports and crucial inflation data. Industry giants, including Micron Technology and Walgreens, are poised to unveil their financial results this week, along with Nike, Rite Aid, and Constellation Brands. These reports will not only provide a comprehensive snapshot of these market leaders but also offer valuable insights into the overall health of the market.
Monday witnessed a broad-based decline across all three major US indices, with the Nasdaq Composite suffering the most from the downturn in tech stocks. Heavyweights like Tesla (TSLA) and Microsoft (MSFT) experienced notable declines, dragging the Nasdaq down. Despite this setback, the tech sector has had a robust performance in 2023, with the Nasdaq registering substantial gains year-to-date.
The geopolitical landscape saw the failed rebellion attempt in Russia over the weekend, resulting in minor ripples across global markets. While oil prices and gold experienced an uptick in response, market volatility remained relatively subdued. Furthermore, the Organization of the Petroleum Exporting Countries (OPEC) projected a sustained rise in global oil demand over the next two decades. These positive sentiments surrounding the energy markets anticipate a substantial 23% increase in overall energy demand by 2045.
In the days ahead, traders will closely monitor key economic indicators to gain deeper insights into the current state of the economy and decipher the Federal Reserve’s future course of action in combatting stubbornly high inflation. Vital data releases, such as consumer confidence and personal consumption expenditures, will shed light on economic trends. Federal Reserve Chair Powell’s upcoming speech, following his previous hawkish remarks, is expected to provide additional clarity. The week will conclude with GDP revisions and pivotal personal consumption expenditure (PCE) data.
Meanwhile, European stocks dipped on Monday, reflecting a downbeat economic sentiment highlighted by a pessimistic survey of German businesses. In Asia, stock markets exhibited mixed performance as investors weighed the implications of recent developments in Russia and maintained a cautious outlook on the global economic landscape.
With investors navigating a landscape of upcoming earnings announcements, economic data releases, and central bank activities, the market’s response to these factors will shape the future trajectory of various sectors and indices. Such developments will play a pivotal role in guiding investment decisions as market participants strive to navigate the ever-evolving financial terrain. Market commentary readers should maintain clearly defined stop levels for all positions.
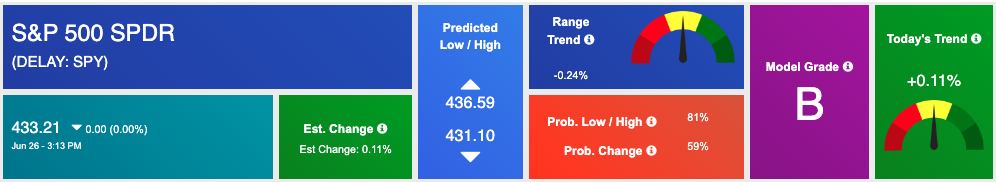
Using the “SPY” symbol to analyze the S&P 500 our 10-day prediction window shows a near-term mixed outlook. Prediction data is uploaded after the market closes at 6 p.m. CST. Today’s data is based on market signals from the previous trading session.
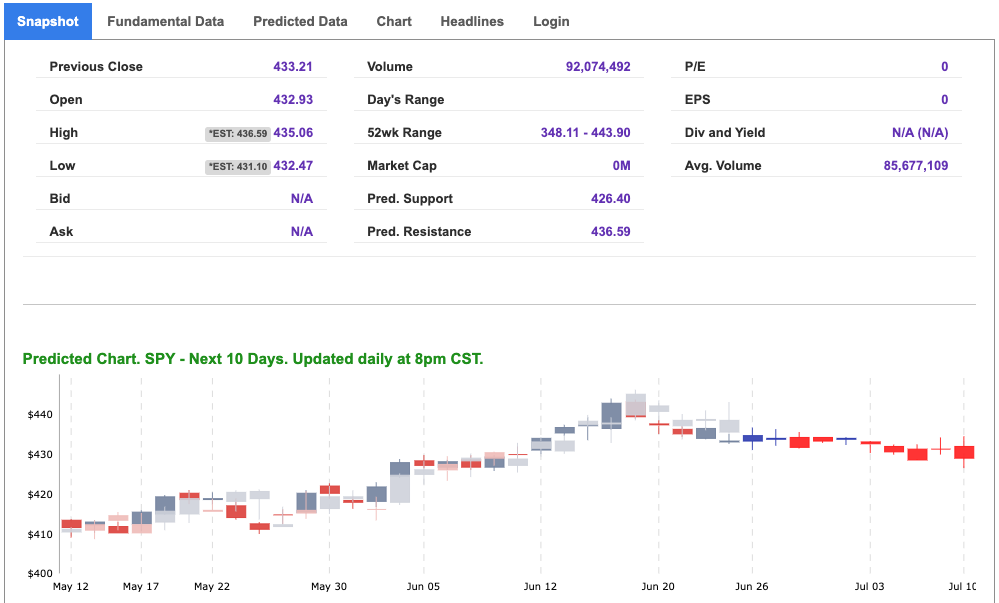
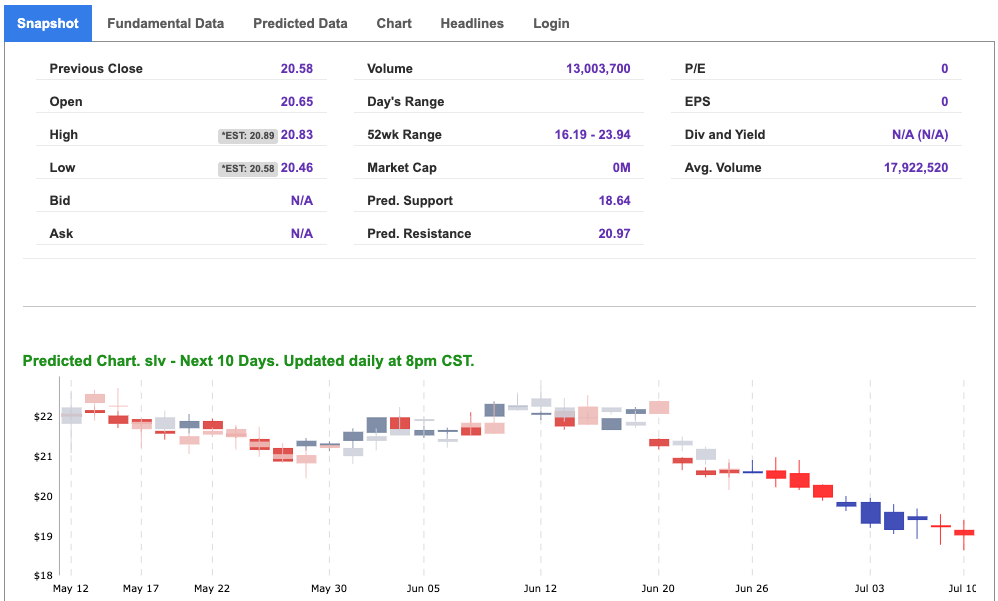
Note: The Vector column calculates the change of the Forecasted Average Price for the next trading session relative to the average of actual prices for the last trading session. The column shows the expected average price movement “Up or Down”, in percent. Trend traders should trade along the predicted direction of the Vector. The higher the value of the Vector the higher its momentum.
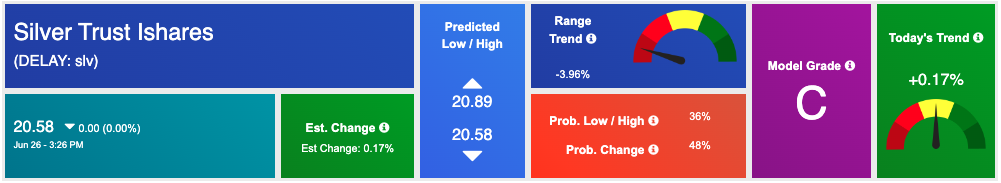
*Please note: At the time of publication Vlad Karpel does have a position in the featured symbol, SLV. Our featured symbol is part of your free subscription service. It is not included in any paid Tradespoon subscription service. Vlad Karpel only trades his money in paid subscription services. If you are a paid subscriber, please review your Premium Member Picks, ActiveTrader, or MonthlyTrader recommendations. If you are interested in receiving Vlad’s picks, please click here.
West Texas Intermediate for Crude Oil delivery (CL.1) is priced at $69.58 per barrel, up 0.61%, at the time of publication.
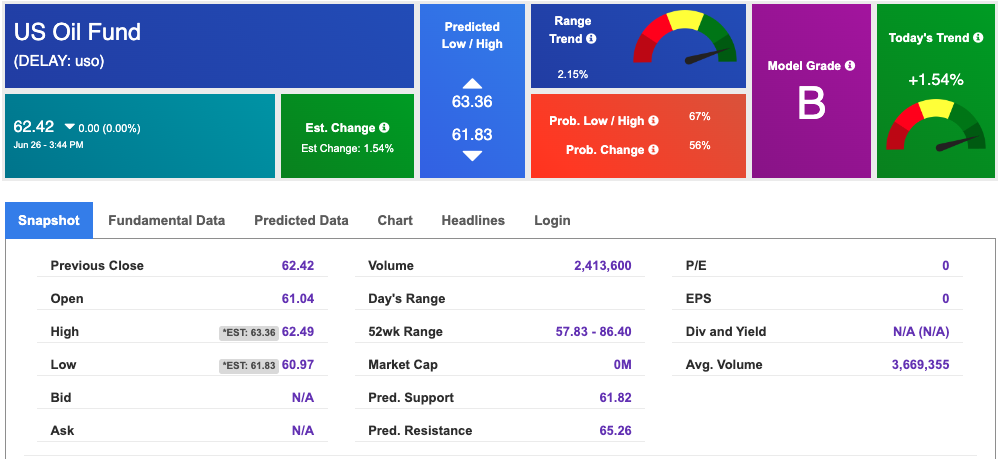
Looking at USO, a crude oil tracker, our 10-day prediction model shows mixed signals. The fund is trading at $62.42 at the time of publication. Prediction data is uploaded after the market close at 6 p.m., CST. Today’s data is based on market signals from the previous trading session.
The price for the Gold Continuous Contract (GC00) is up 0.19% at $1933.20 at the time of publication.
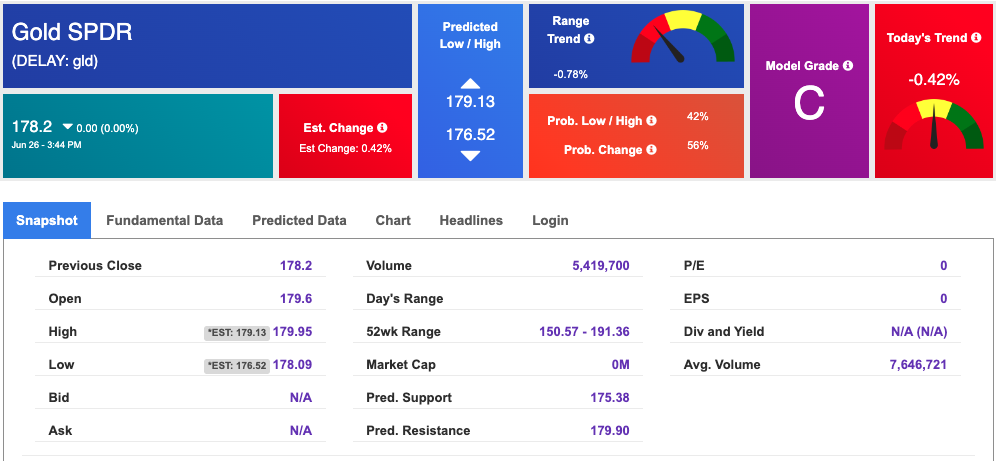
Using SPDR GOLD TRUST (GLD) as a tracker in our Stock Forecast Tool, the 10-day prediction window shows mixed signals. The gold proxy is trading at $178.2 at the time of publication. Vector signals show -0.42% for today. Prediction data is uploaded after the market close at 6 p.m., CST. Today’s data is based on market signals from the previous trading session.
The yield on the 10-year Treasury note is down at 3.724% at the time of publication.
The yield on the 30-year Treasury note is up at 3.817% at the time of publication.
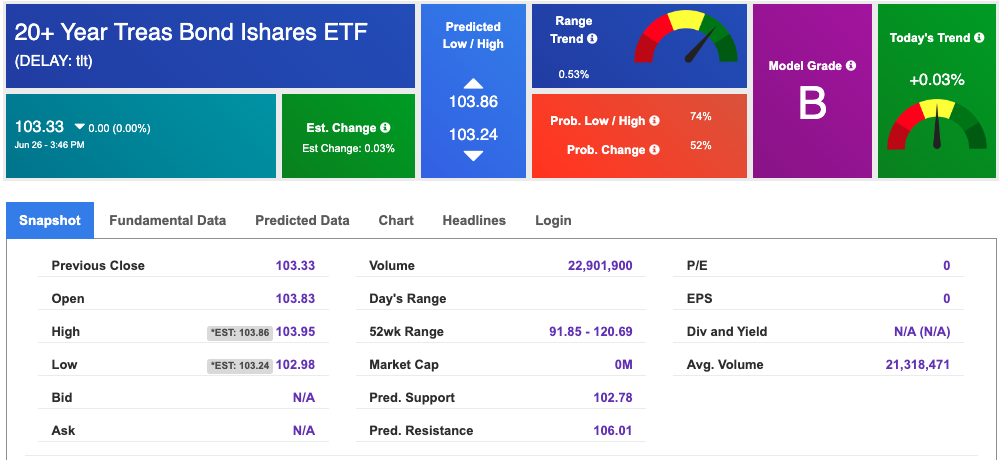
Using the iShares 20+ Year Treasury Bond ETF (TLT) as a proxy for bond prices in our Stock Forecast Tool, we see mixed signals in our 10-day prediction window. Prediction data is uploaded after the market close at 6 p.m., CST. Today’s data is based on market signals from the previous trading session.
The CBOE Volatility Index (^VIX) is priced at $14.25, up 6.03% at the time of publication, and our 10-day prediction window shows mixed signals. Prediction data is uploaded after the market close at 6 p.m., CST. Today’s data is based on market signals from the previous trading session.
Please share this Tradespoon Market Commentary with your friends.
![]()

![]()
Comments Off on


Tradespoon Tools make finding winning trades in minute as easy as 1-2-3.
Our simple 3 step approach has resulted in an average return of almost 20% per trade!

