 Sign Up for One-on-One Coaching and get our Premium Membership FREE for 1 Year!
CLICK HERE TO APPLY
Sign Up for One-on-One Coaching and get our Premium Membership FREE for 1 Year!
CLICK HERE TO APPLY
Stocks experienced a downturn on Monday, reflecting a cautious sentiment among investors as they await crucial inflation data expected later this week. The forthcoming data is anticipated to influence the Federal Reserve’s decisions regarding interest rates throughout the year. The dollar extended its decline from the previous week, with market focus intensifying on forthcoming U.S. economic indicators to gauge the potential pace of interest rate adjustments by the Federal Reserve.
The looming specter of persistent inflation remains a significant concern, drawing attention to Thursday’s release of core personal consumption expenditures (PCE) price growth data. This metric holds particular significance for the Federal Reserve as its preferred gauge of inflation. The outcome of this data release could potentially shape market dynamics in the days to come.
While Monday saw a mixed performance across the major indexes, they are still poised to secure a fourth consecutive month of gains if they can maintain stability leading up to Thursday’s close. This resilience amidst uncertainty underscores the market’s cautious optimism despite recent fluctuations.
Nvidia, the prominent chip manufacturer, once again flirted with a $2 trillion market capitalization before relinquishing some of its gains. Last Friday marked the first occasion where Nvidia briefly touched this milestone, although it has yet to close at that level. The surge in Nvidia’s shares last week followed a period of decline preceding the company’s January quarter earnings report. However, exceeding expectations on sustained demand for its chips, particularly from artificial intelligence startups, propelled Nvidia’s shares to record highs.
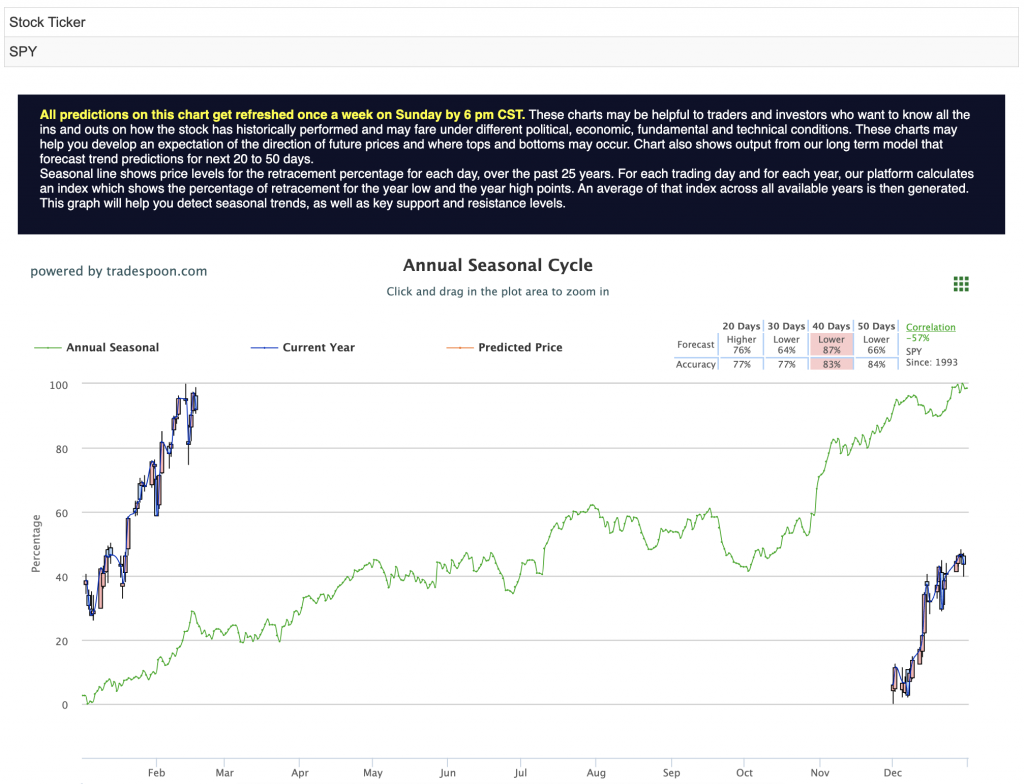
Investor attention remains fixated on forthcoming remarks from Federal Reserve officials, which could offer insights into the central bank’s stance leading up to its monetary policy committee meeting scheduled for March 19-20. As markets navigate through volatile conditions, the performance of key benchmarks such as the SPDR S&P 500 ETF (SPY) becomes crucial. Support levels are closely monitored around the $460-470 range, while resistance is identified at $500-510, indicating the current market sentiment and potential future trajectories. For reference, the SPY Seasonal Chart is shown below:
Looking ahead, a plethora of companies are set to report earnings later this week, including Lowe’s, Monster Beverage, AutoZone, eBay, First Solar, Salesforce, Snowflake, TJX Cos., Baidu, HP Inc., Paramount Global, Okta, Nutanix, Macy’s, Anheuser-Busch, Dell Technologies, Autodesk, Zscaler, Hewlett Packard Enterprise, C3.ai, Best Buy, Plug Power, and fuboTV. These reports are likely to provide further insights into the performance of various sectors amidst the ongoing economic uncertainties.
In conclusion, while market volatility persists, informed by evolving economic indicators and corporate earnings, investors remain vigilant, strategically positioning themselves in response to unfolding developments both domestically and globally.
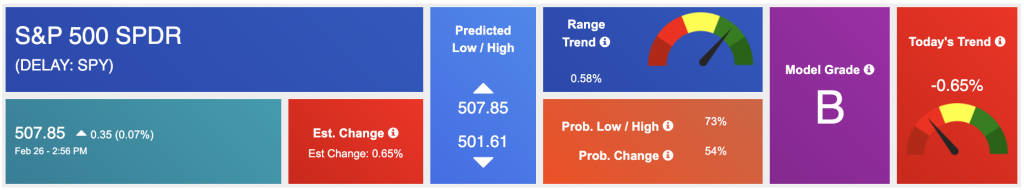
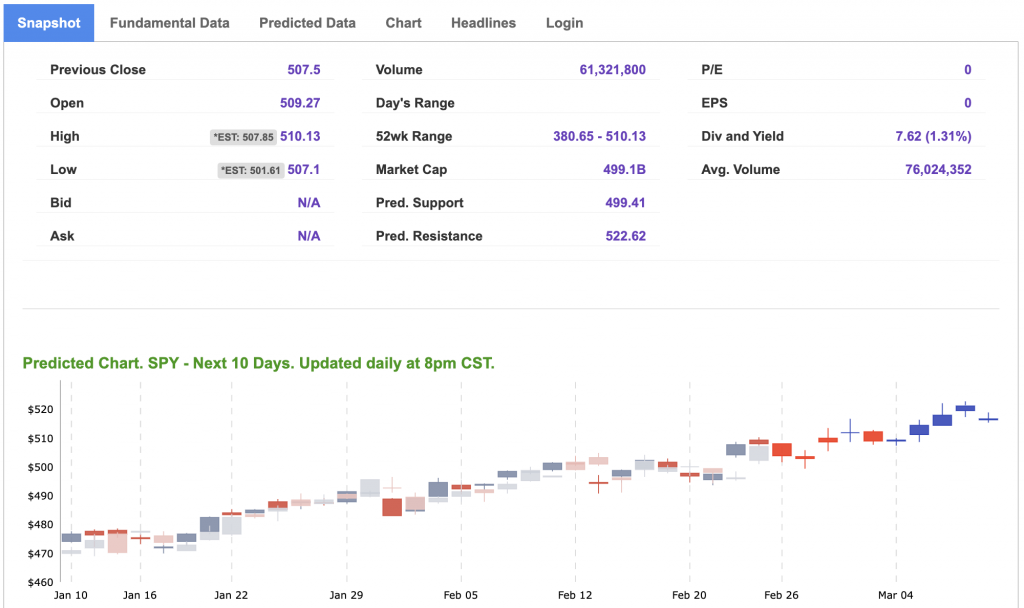
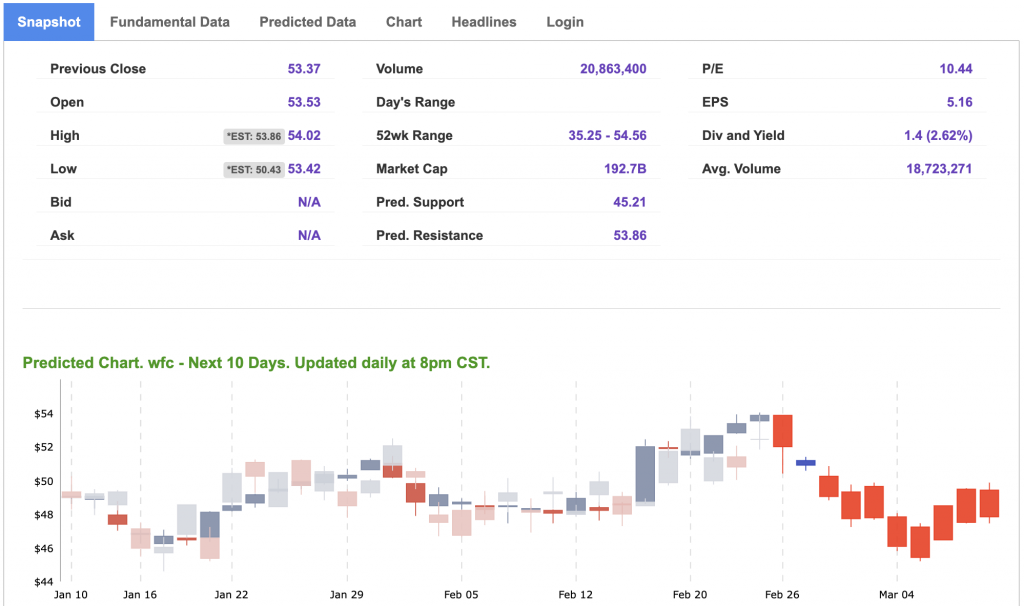
Using the “SPY” symbol to analyze the S&P 500 our 10-day prediction window shows a near-term positive outlook. Prediction data is uploaded after the market closes at 6 p.m. CST. Today’s data is based on market signals from the previous trading session.
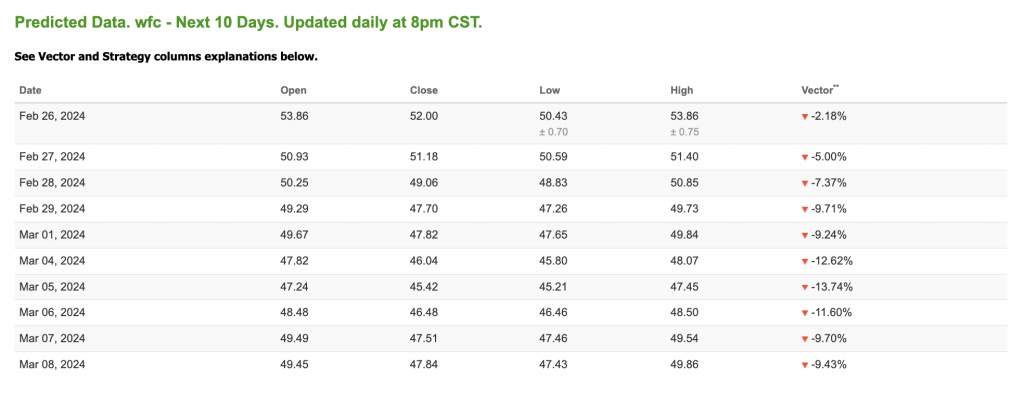
Note: The Vector column calculates the change of the Forecasted Average Price for the next trading session relative to the average of actual prices for the last trading session. The column shows the expected average price movement “Up or Down”, in percent. Trend traders should trade along the predicted direction of the Vector. The higher the value of the Vector the higher its momentum.
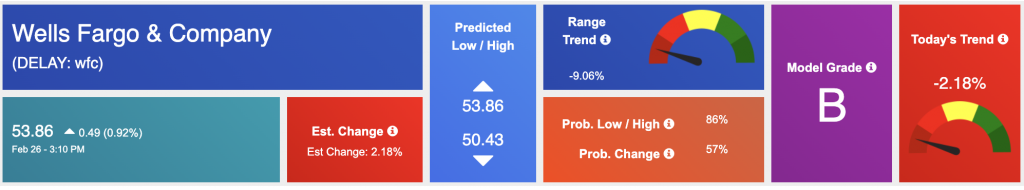
*Please note: At the time of publication Vlad Karpel does have a position in the featured symbol, WFC. Our featured symbol is part of your free subscription service. It is not included in any paid Tradespoon subscription service. Vlad Karpel only trades his money in paid subscription services. If you are a paid subscriber, please review your Premium Member Picks, ActiveTrader, or MonthlyTrader recommendations. If you are interested in receiving Vlad’s picks, please click here.
West Texas Intermediate for Crude Oil delivery (CL.1) is priced at $77.57 per barrel, up 1.41%, at the time of publication.
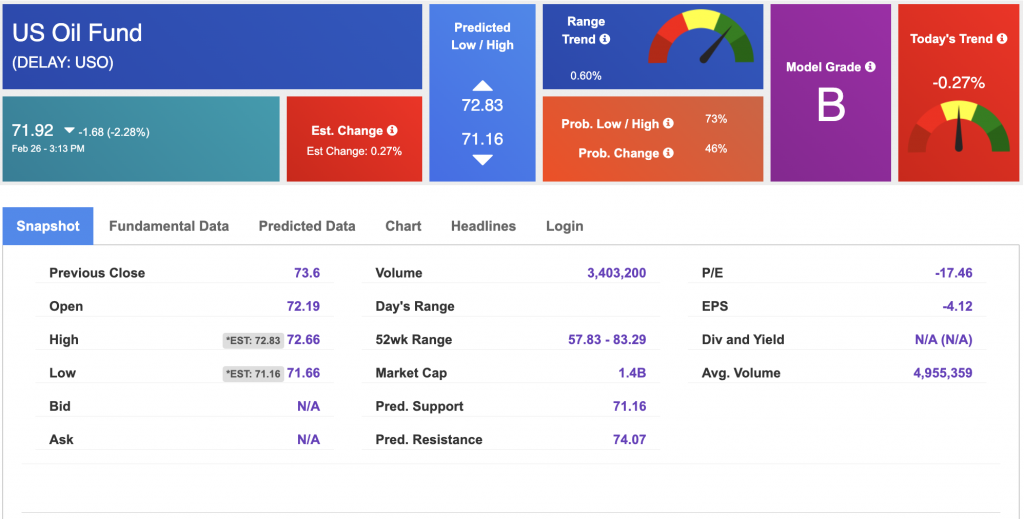
Looking at USO, a crude oil tracker, our 10-day prediction model shows mixed signals. The fund is trading at $71.92 at the time of publication. Prediction data is uploaded after the market close at 6 p.m., CST. Today’s data is based on market signals from the previous trading session.
The price for the Gold Continuous Contract (GC00) is down 0.38% at $2041.60 at the time of publication.
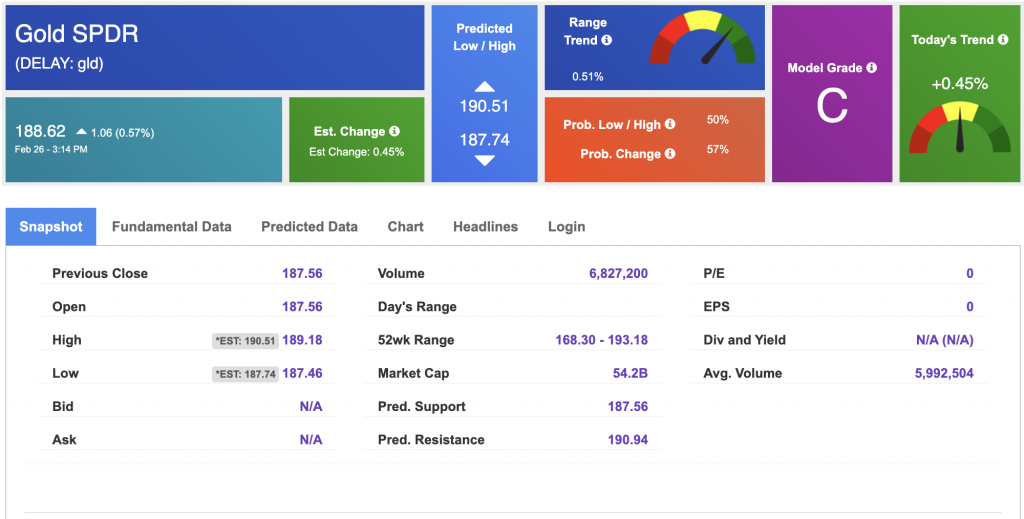
Using SPDR GOLD TRUST (GLD) as a tracker in our Stock Forecast Tool, the 10-day prediction window shows mixed signals. The gold proxy is trading at $188.62 at the time of publication. Vector signals show +0.45% for today. Prediction data is uploaded after the market close at 6 p.m., CST. Today’s data is based on market signals from the previous trading session.
The yield on the 10-year Treasury note is up at 4.282% at the time of publication.
The yield on the 30-year Treasury note is up at 4.397% at the time of publication.
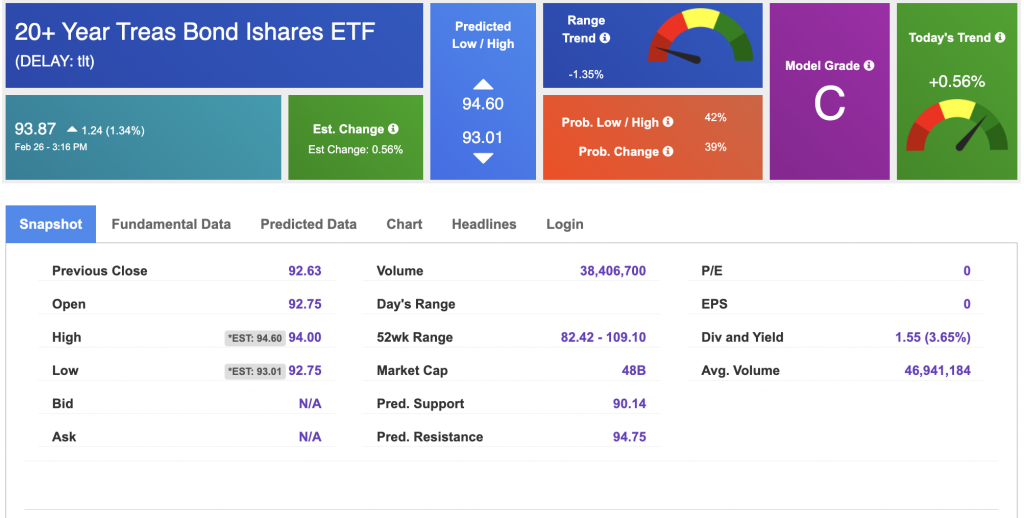
Using the iShares 20+ Year Treasury Bond ETF (TLT) as a proxy for bond prices in our Stock Forecast Tool, we see mixed signals in our 10-day prediction window. Prediction data is uploaded after the market close at 6 p.m., CST. Today’s data is based on market signals from the previous trading session.
The CBOE Volatility Index (^VIX) is priced at $13.74 down 0.01% at the time of publication, and our 10-day prediction window shows mixed signals. Prediction data is uploaded after the market close at 6 p.m., CST. Today’s data is based on market signals from the previous trading session.

Please share this Tradespoon Market Commentary with your friends.
![]()

![]()
Comments Off on


Tradespoon Tools make finding winning trades in minute as easy as 1-2-3.
Our simple 3 step approach has resulted in an average return of almost 20% per trade!