 Special Offer: Try the 'Elite Trading Circle Membership' for ONLY $37!
CLICK HERE TO LEARN MORE
Special Offer: Try the 'Elite Trading Circle Membership' for ONLY $37!
CLICK HERE TO LEARN MORE
In the opening week of December, the stock market took a cautious step back after a sustained rally fueled by optimism surrounding potential Federal Reserve interest rate cuts in the coming year. On Monday, the S&P 500, Dow Jones Industrial Average, and Nasdaq Composite all experienced declines, interrupting their impressive five-week winning streak.
Federal Reserve Chair Jerome Powell, in a noteworthy address last week, acknowledged the progress in taming inflation, inching closer to the 2% target. Despite this success, Powell maintained a cautious optimism, highlighting the Fed’s readiness to tighten monetary policy further if necessary. The core PCE index, a crucial measure excluding volatile components, stood at 3.5% in October. Powell emphasized uncertainties in the economic outlook, citing factors such as the normalization of pandemic-induced demand and persistent supply-chain challenges.
Investors responded subtly to Powell’s remarks, triggering a recalibration of expectations. The market is now factoring in the potential for multiple rate cuts in 2024, possibly as early as March. This adjustment played a pivotal role in propelling the S&P 500 to its most robust month since July 2022. The positive sentiment, coupled with diminishing inflation and falling interest rates, is reflected in the upward trajectory of assets like $TLT and $LQD.
Earnings reports from key players like $ZS, $PANW, and security stocks highlighted resilience with solid performances. Despite surpassing expectations and projecting future revenue growth, overbought conditions led to stock declines, with some witnessing drops of up to 4%. This dynamic underscores the delicate balance between strong corporate performance and the prevailing market conditions.
The Federal Reserve’s Beige Book, unveiled last week, offers a detailed mosaic of economic conditions nationwide. The report reveals a nuanced picture, indicating a broad softening in the labor market with flat to modest employment growth. Six of the 12 Fed regional banks reported slight declines in economic activity, providing real-time insights into region-specific challenges. This nuanced narrative significantly contributes to expectations of a more accommodative monetary policy.
The ISM’s Purchasing Managers Index for November highlighted the manufacturing sector’s contraction for the 13th consecutive month, falling below expectations. This prolonged contraction, the longest in decades, raises pertinent questions about the trajectory of economic growth. With key economic indicators like CPI, PPI, unemployment figures, and Powell’s cautious stance, the market is poised for potential shifts in the coming weeks.
As Wall Street navigates through December, the big question looming is whether the cheer from November can sustain the holiday spirit. A barrage of economic data, including the eagerly awaited jobs report on Friday, will be pivotal. Investors keenly watch labor numbers, adjusting their expectations about interest rates. The rally in stocks over the past month reflects hopes for imminent rate cuts.
In other market developments, gold prices retreated from earlier record highs, while Bitcoin climbed to a 20-month peak. Despite heightened tensions in the Middle East, including Israel’s escalation with Hamas and attacks on commercial ships by Iran-backed Houthi rebels in the Red Sea, oil prices took a nosedive.
The tech-heavy Nasdaq Composite led the decline on Monday, down 1.1%. If this trend persists until close, it would mark the largest one-day percentage decline since October 26. For comparison, the Dow Jones Industrial Average was off 0.2%, and the S&P 500 was off 0.6%.
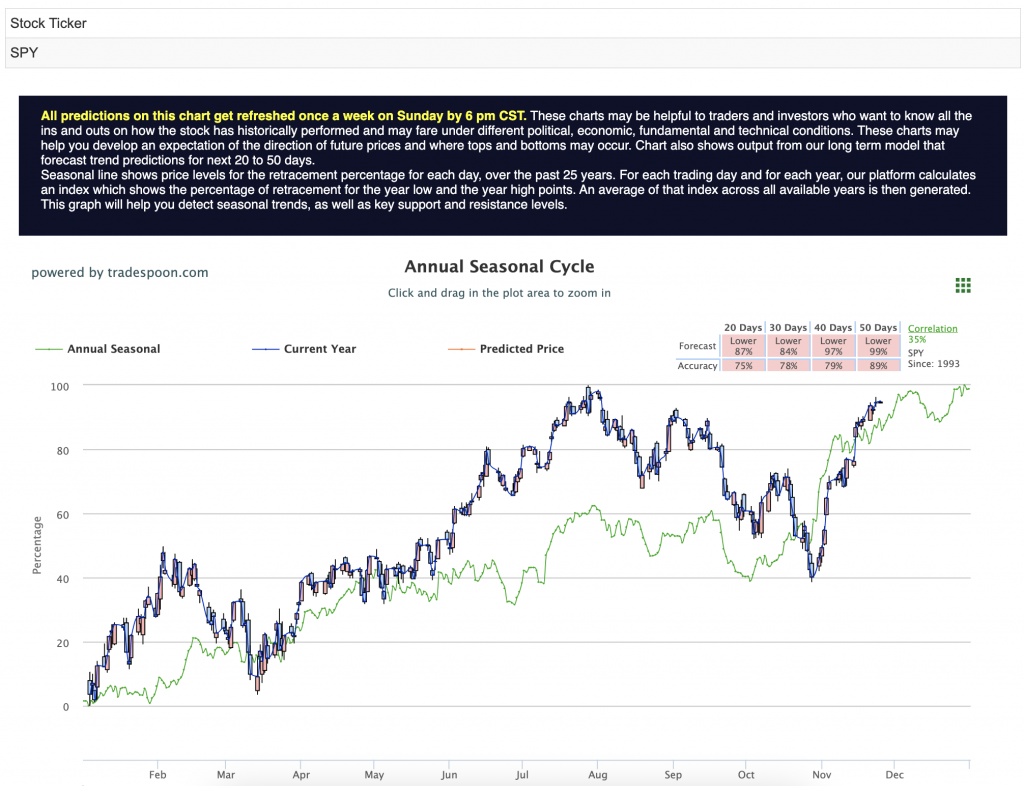
As the year draws to a close, attention turns to individual stock movements and macroeconomic data as potential catalysts, shaping the course of future trends. The market, in a short-term overbought state, treads with caution, anticipating a shallow pullback in the next few weeks and closely monitoring the designated ranges for key indices. The SPY rally is approached with discernment, recognizing a capped range between $450-470 and anticipations of short-term support between $400-430. The market’s gaze shifts towards individual stock movements and macroeconomic data as potential catalysts, steering the course of future trends. For reference, the SPY Seasonal Chart is shown below:
The coming weeks promise to be dynamic, with the market responding to economic indicators, central bank decisions, and geopolitical events. The delicate balancing act continues, and investors remain vigilant for signals that could influence the market’s trajectory.
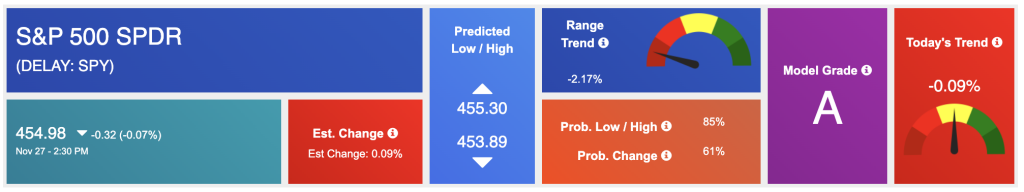
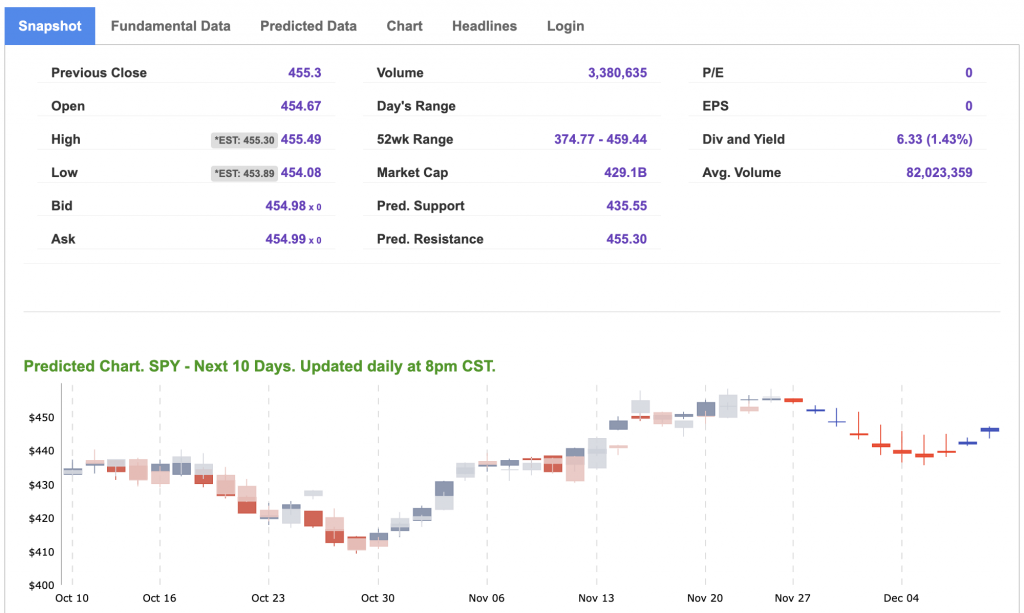
Using the “SPY” symbol to analyze the S&P 500 our 10-day prediction window shows a near-term positive outlook. Prediction data is uploaded after the market closes at 6 p.m. CST. Today’s data is based on market signals from the previous trading session.
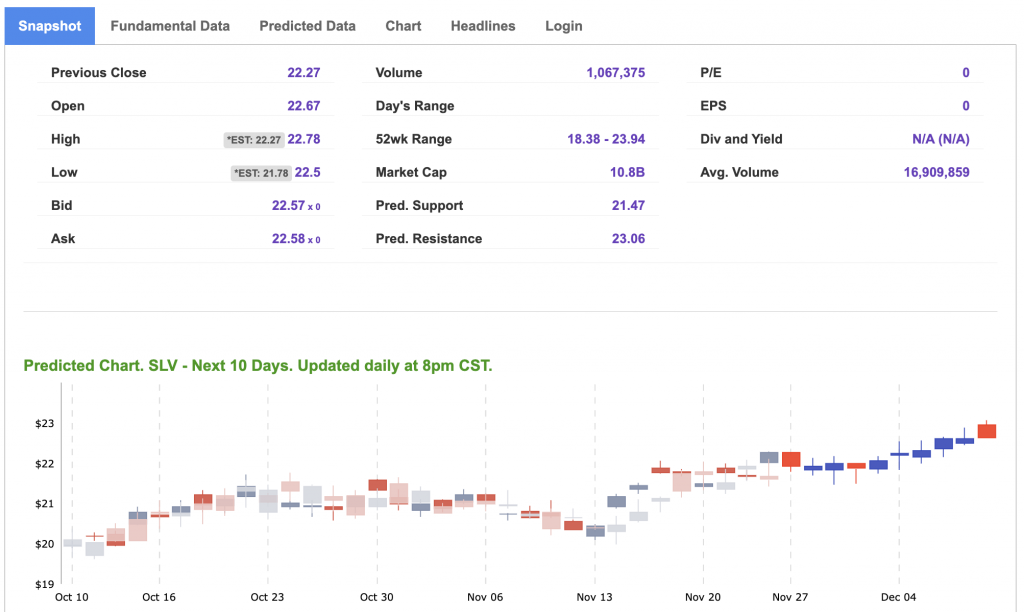
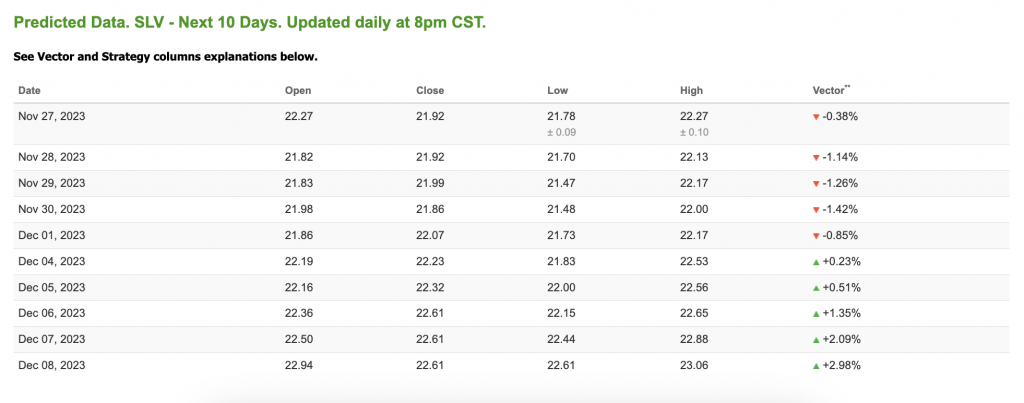
Note: The Vector column calculates the change of the Forecasted Average Price for the next trading session relative to the average of actual prices for the last trading session. The column shows the expected average price movement “Up or Down”, in percent. Trend traders should trade along the predicted direction of the Vector. The higher the value of the Vector the higher its momentum.
*Please note: At the time of publication Vlad Karpel does NOT have a position in the featured symbol, MSFT. Our featured symbol is part of your free subscription service. It is not included in any paid Tradespoon subscription service. Vlad Karpel only trades his money in paid subscription services. If you are a paid subscriber, please review your Premium Member Picks, ActiveTrader, or MonthlyTrader recommendations. If you are interested in receiving Vlad’s picks, please click here.
West Texas Intermediate for Crude Oil delivery (CL.1) is priced at $77.50 per barrel, up 2.12%, at the time of publication.
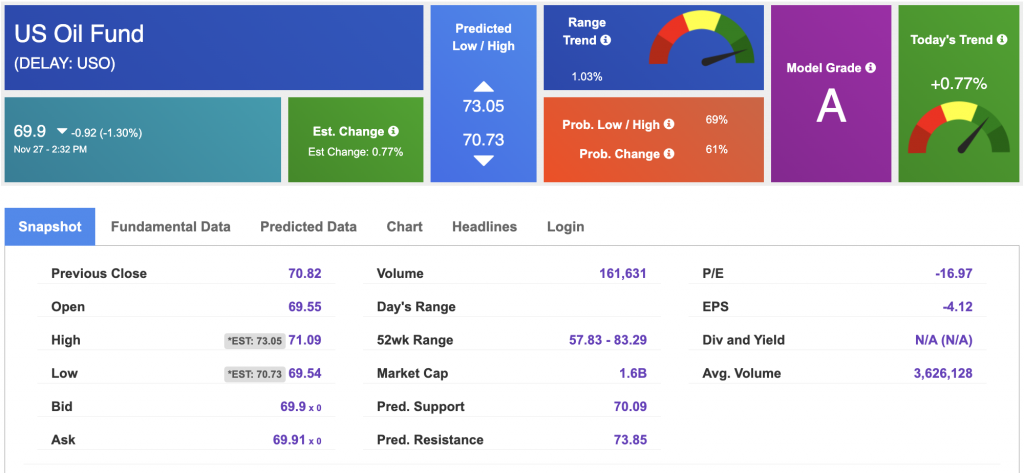
Looking at USO, a crude oil tracker, our 10-day prediction model shows mixed signals. The fund is trading at $69.9 at the time of publication. Prediction data is uploaded after the market close at 6 p.m., CST. Today’s data is based on market signals from the previous trading session.
The price for the Gold Continuous Contract (GC00) is down 0.23% at $1980.20 at the time of publication.
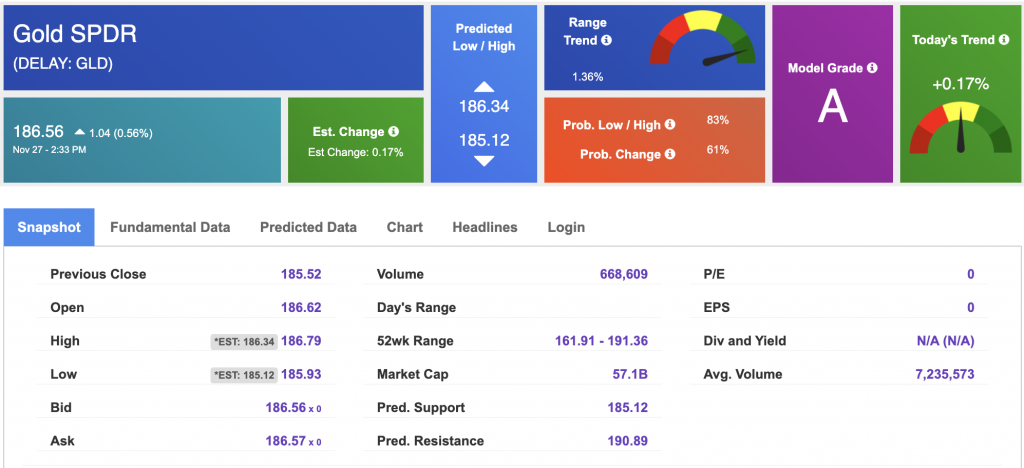
Using SPDR GOLD TRUST (GLD) as a tracker in our Stock Forecast Tool, the 10-day prediction window shows mixed signals. The gold proxy is trading at $186.56 at the time of publication. Vector signals show +0.17% for today. Prediction data is uploaded after the market close at 6 p.m., CST. Today’s data is based on market signals from the previous trading session.
The yield on the 10-year Treasury note is down at 4.392% at the time of publication.
The yield on the 30-year Treasury note is down at 4.533% at the time of publication.
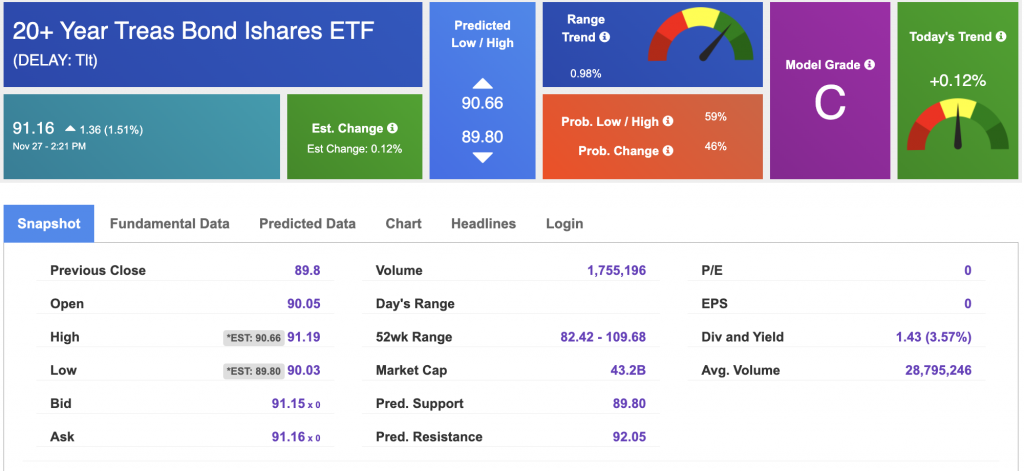
Using the iShares 20+ Year Treasury Bond ETF (TLT) as a proxy for bond prices in our Stock Forecast Tool, we see mixed signals in our 10-day prediction window. Prediction data is uploaded after the market close at 6 p.m., CST. Today’s data is based on market signals from the previous trading session.
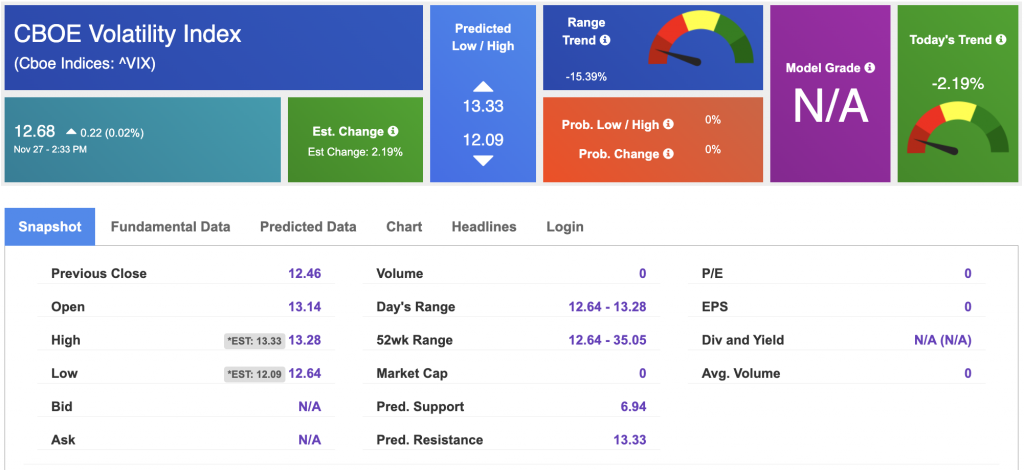
The CBOE Volatility Index (^VIX) is priced at $12.68 up 0.02% at the time of publication, and our 10-day prediction window shows mixed signals. Prediction data is uploaded after the market close at 6 p.m., CST. Today’s data is based on market signals from the previous trading session.
Please share this Tradespoon Market Commentary with your friends.
![]()

![]()
Comments Off on


Tradespoon Tools make finding winning trades in minute as easy as 1-2-3.
Our simple 3 step approach has resulted in an average return of almost 20% per trade!

