 Special Offer: Try the 'Elite Trading Circle Membership' for ONLY $37!
CLICK HERE TO LEARN MORE
Special Offer: Try the 'Elite Trading Circle Membership' for ONLY $37!
CLICK HERE TO LEARN MORE
After CPI data was released and showed a modest decline in prices, alleviating pressure on the Federal Reserve, equities closed at their highest level since May. All three major U.S. indices closed in the green, with the Nasdaq returning to bull territory. In the latest CPI report, the Labor Department said the consumer price index stayed level in July, compared to a 1.3% rise in June. Inflation slowed to 8.5% in the 12 months ended July 31st, down from 9.1 percent in June and a 41-year high of 9.1%. This will come into consideration when the Federal Reserve meets on September 20-21 for its latest policy meeting, where it is anticipated to raise interest rates. After the release of July inflation data, the odds that the Fed will raise interest rates by 50 basis points in September have increased significantly. Long-term note yields fell at the mid-point of the week while crude oil rose. Gold and the dollar, traditionally trading inversely, both fell as well.
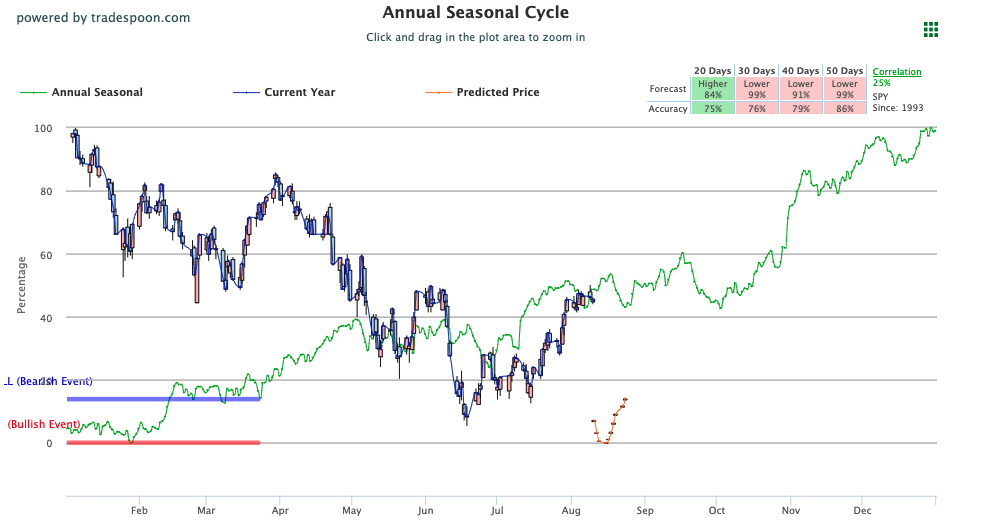
Look out for the July Import Price Index to release on Friday; next week we are watching July retail sales, due Wednesday, and Industrial Production, due Tuesday. The $VIX is trading near the 20 level and we are still monitoring the market’s reaction following The $AIG, $DIS, and $EMR earnings and the CPI/PPI numbers. We are watching the overhead resistance levels in the SPY, which are presently at $420 and then $430. The $SPY support is at $406 and then $401. We expect the market to continue the short-term rally for the next few weeks. We’d be a seller in any further rallies, and we advise subscribers not to chase the market at these prices. Globally, European markets traded impressively higher while Asian markets traded closed in the red. We encourage all market commentary readers to maintain clearly defined stop levels for all positions. For reference, the SPY Seasonal Chart is shown below:
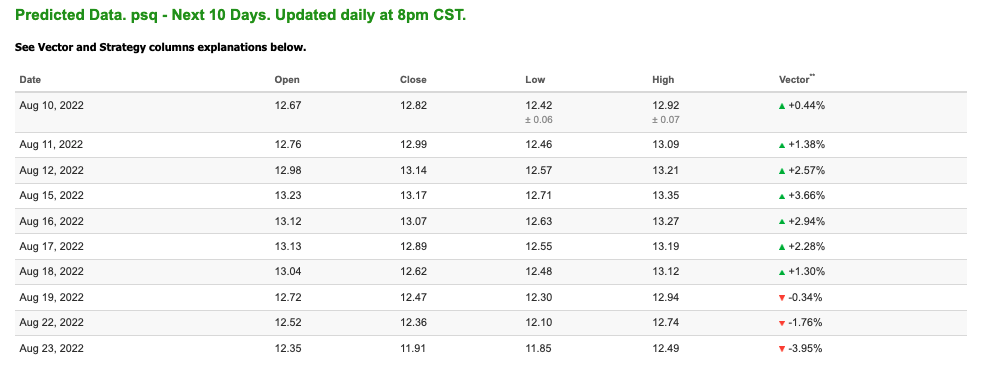
Note: The Vector column calculates the change of the Forecasted Average Price for the next trading session relative to the average of actual prices for the last trading session. The column shows the expected average price movement “Up or Down”, in percent. Trend traders should trade along the predicted direction of the Vector. The higher the value of the Vector the higher its momentum.
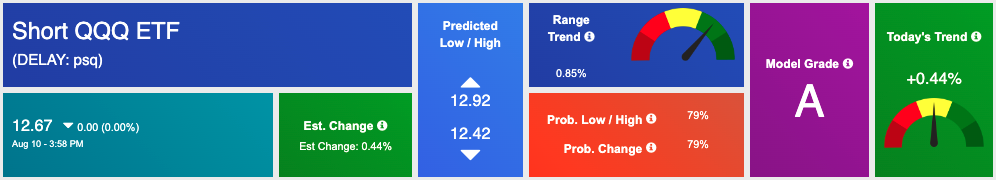
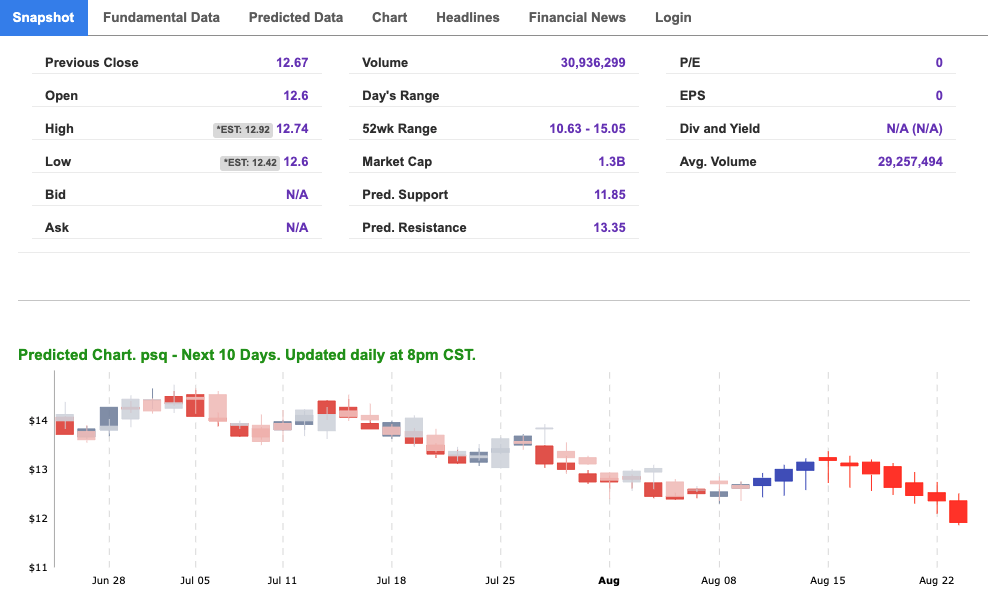
*Please note: At the time of publication Vlad Karpel does have a position in the featured symbol, PSQ. Our featured symbol is part of your free subscription service. It is not included in any paid Tradespoon subscription service. Vlad Karpel only trades his money in paid subscription services. If you are a paid subscriber, please review your Premium Member Picks, ActiveTrader, or MonthlyTrader recommendations. If you are interested in receiving Vlad’s picks, please click here.
West Texas Intermediate for Crude Oil delivery (CL.1) is priced at $91.57 per barrel, up 1.18%, at the time of publication.
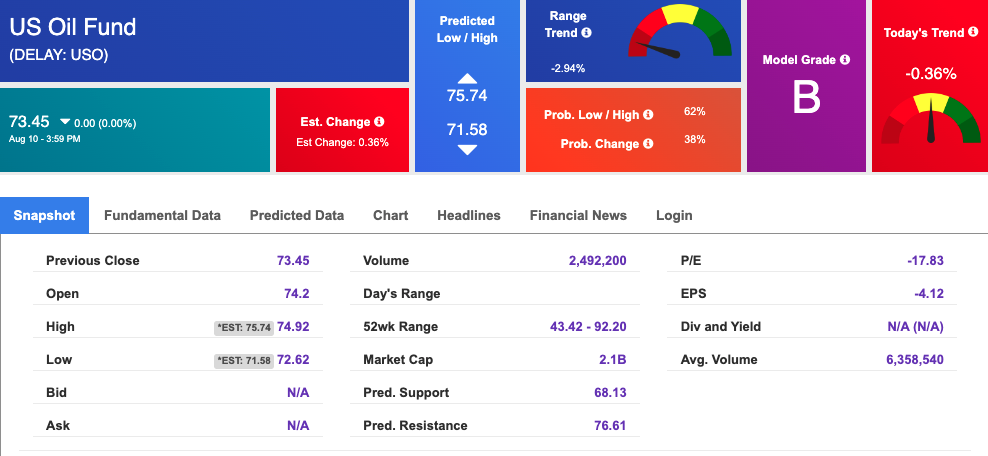
Looking at USO, a crude oil tracker, our 10-day prediction model shows mixed signals. The fund is trading at $73.45 at the time of publication. Prediction data is uploaded after the market close at 6 p.m., CST. Today’s data is based on market signals from the previous trading session.
The price for the Gold Continuous Contract (GC00) is down 0.24% at $1808.00 at the time of publication.
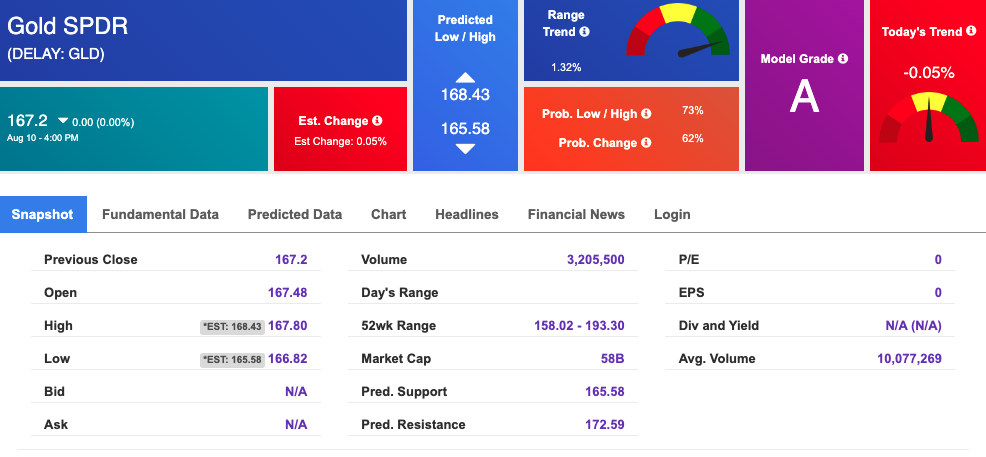
Using SPDR GOLD TRUST (GLD) as a tracker in our Stock Forecast Tool, the 10-day prediction window shows mixed signals. The gold proxy is trading at $167.2 at the time of publication. Vector signals show -0.05% for today. Prediction data is uploaded after the market close at 6 p.m., CST. Today’s data is based on market signals from the previous trading session.
The yield on the 10-year Treasury note is up, at 2.788% at the time of publication.
The yield on the 30-year Treasury note is up, at 3.035% at the time of publication.
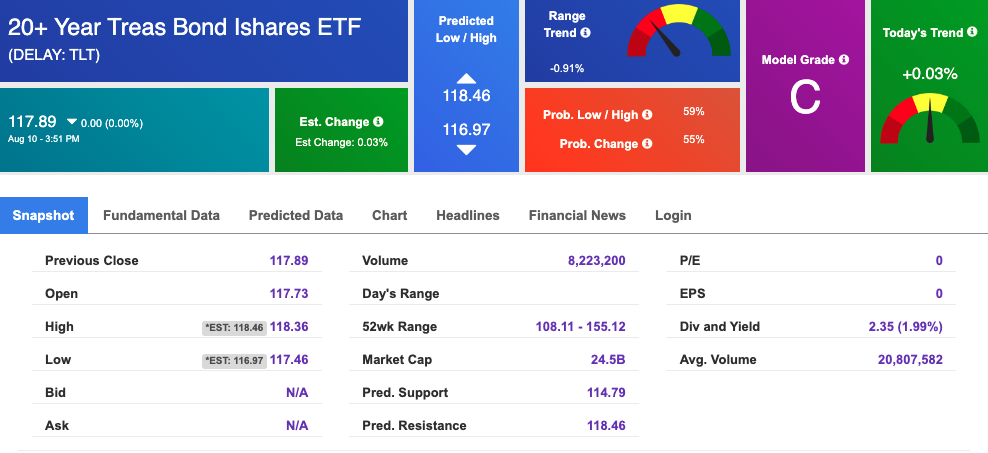
Using the iShares 20+ Year Treasury Bond ETF (TLT) as a proxy for bond prices in our Stock Forecast Tool, we see mixed signals in our 10-day prediction window. Prediction data is uploaded after the market close at 6 p.m., CST. Today’s data is based on market signals from the previous trading session.
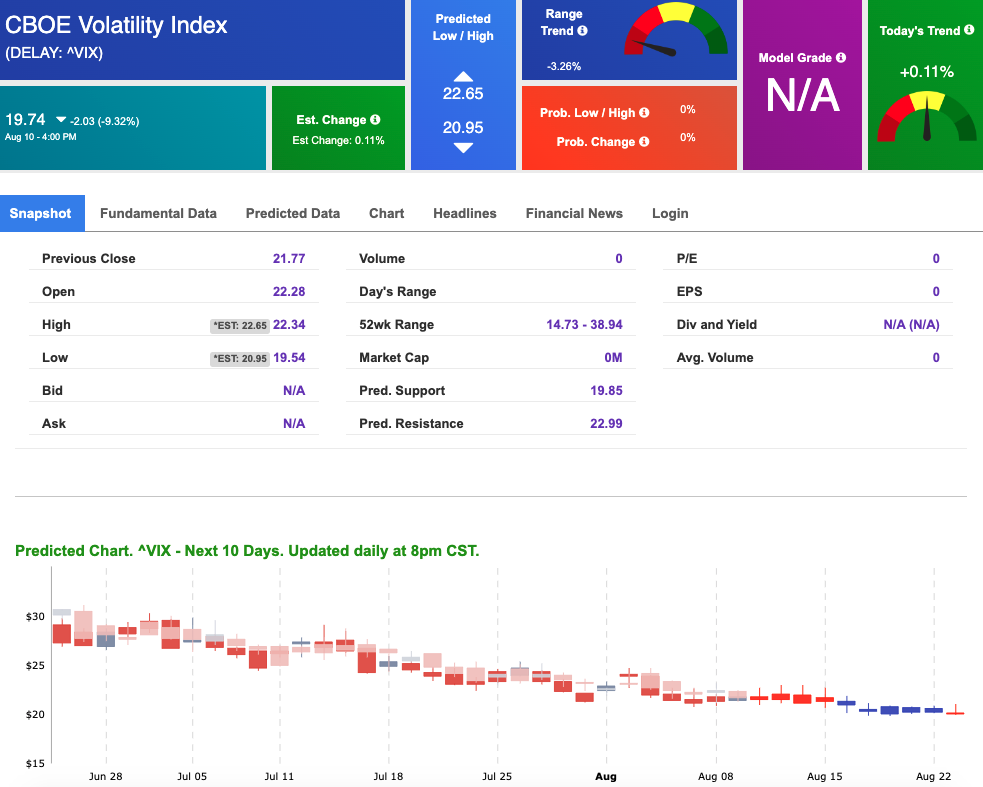
The CBOE Volatility Index (^VIX) is $19.74 at the time of publication, and our 10-day prediction window shows mixed signals. Prediction data is uploaded after the market close at 6 p.m., CST. Today’s data is based on market signals from the previous trading session.
Please share this Tradespoon Market Commentary with your friends.
![]()

![]()
Comments Off on


Tradespoon Tools make finding winning trades in minute as easy as 1-2-3.
Our simple 3 step approach has resulted in an average return of almost 20% per trade!

