Special Offer: Try the 'Elite Trading Circle Membership' for ONLY $37!
CLICK HERE TO LEARN MORE
Special Offer: Try the 'Elite Trading Circle Membership' for ONLY $37!
CLICK HERE TO LEARN MORE
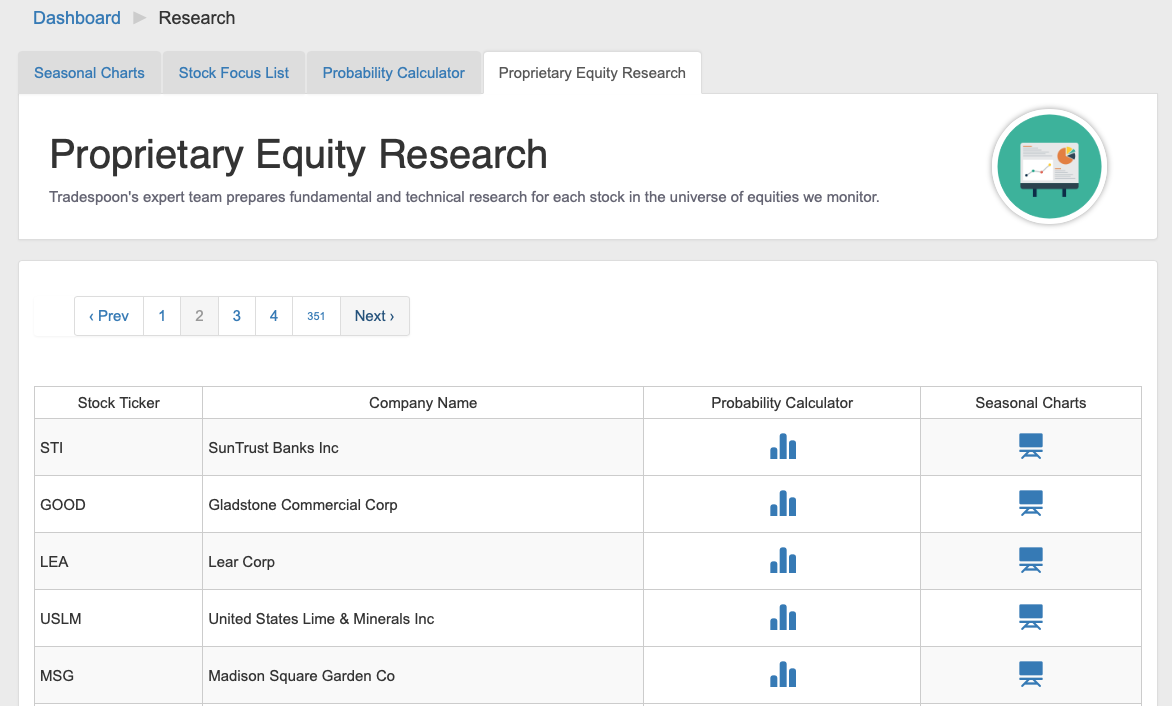
In our Proprietary Equity Research suite, you'll have access to a range of analysis and scoring based on several algorithmic models applied by our artificial neural network. The resulting reports are regularly updated and provide a robust view of a stock and its predicted future performance across several time horizons. There are three components to this research suite:
Value/Momentum Score & Outlook - This score conveys Tradespoon's long-term outlook of 1 to 5 years for a particular stock. Tradespoon uses proprietary methods to rate its trading recommendations on a scale from 1 to 10, with 10 being the most favorable risk and return outlook. To determine a stock's rating, Tradespoon uses an advanced algorithm that factors in fundamental and technical analysis to determine a stock's expected risk and return.
Seasonal Charts - Review graphs depicting the historical performance of each stock to help forecast future performance. See how a stock has performed historically and will likely fare under different political, economic, fundamental and technical conditions. Our Annual Seasonal Trend Line graphs price levels for the retracement percentage for each day, over the past 25 years. For each trading day and for each year, our platform calculates an index which shows the percentage of retracement for the year low and the year high points. An average of that index across all available years is then generated. This graph will help you detect seasonal trends, as well as key support and resistance levels. This tool may also help you:
Probability Calculator - The Probability Calculator may help determine the statistical likelihood of an underlying stock trading above, below, or between certain price targets on a specified date. This calculator also includes our Short-term Trend Rating, consisting of 2 different quant models that run independently for 20,30 ,40 and 50 days forecast. The output is generated by predictive models that forecast the stock price movement for 20, 30, 40 and 50 days from now.